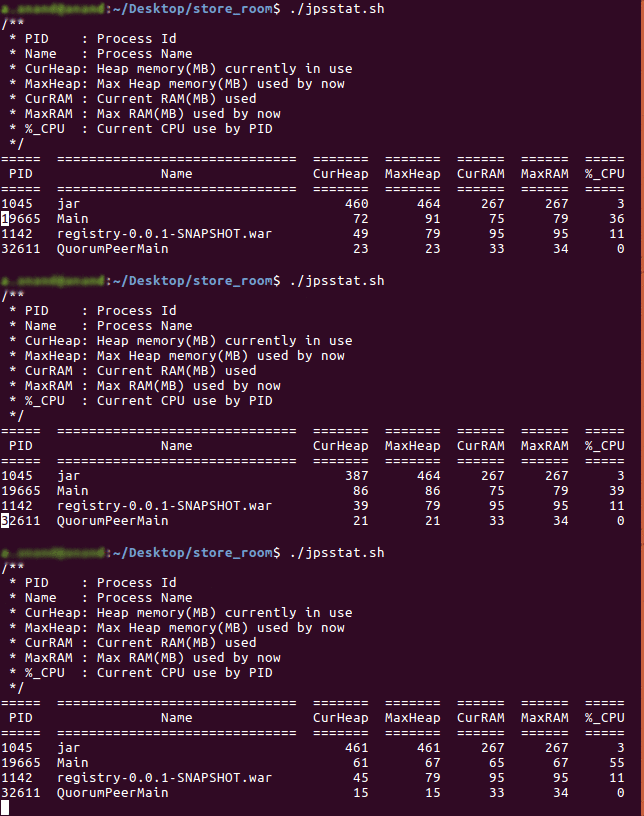
How to profile Python/Django applications

Using the django-profiler module available at https://github.com/char0n/django-profiler

from profiling import profile

and later:

@profile(stats=True)
def view_to_be_profiled(self, request):
    ...

There’s a couple of settings that it’s possible to enable to view SQL queries and tweak the logger name:

PROFILING_SQL_QUERIES = True
PROFILING_LOGGER_NAME = 'profiler'

Just a reminder for myself. Nothing more.

MySQL (Percona XtraDB) slave replication crash resilience settings

It’s been a geological age since my last blog post!

Oh, so many things happened in the meantime. For the past four years, I worked on the development and operations side of the news recommendation system that powered Opera Discover. With enough energy, I have planned to write a recommender systems “primer” series. We’ll see.

Meanwhile, I’d like to keep these notes here. They’ve been useful to make MySQL replication recover gracefully from network instability, abrupt disconnections and generally datacenter failures. Here they are.

Coming MySQL 5.6 on Debian Wheezy, we began to experience mysql replication breakages after abrupt shutdowns or sudden machine crashes. When systems came back up, more frequently then not, mysql replication would stop due to corrupted slave relay logs.

I started investigating this problem and soon found documentation and blog posts describing the log corruption issues and how mysql development addressed that. Here’s the pages I used as references:

Additionally, we had (I believe unrelated) problems with some mysql meta tables that couldn’t be queried, even though they were listed as existing in the mysql shell and in the filesystem.
We solved this problem with the following steps:

DROP TABLE innodb_table_stats;
ALTER TABLE innodb_table_stats DISCARD TABLESPACE;
stop mysql
rm -rf /var/lib/mysql/mysql/innodb_table_stats.*
restart mysql

These steps have to be executed in this order, even if altering a table after having dropped it may seem nonsensical. It is nonsensical, as sometimes mysql things are.

Crash safe replication settings

We’ve distilled a set of standalone replication settings that will provide years and years of unlimited crash-safe replication fun (maybe). Here they are:

# More resilient slave crash recovery
master-info-repository = TABLE
relay-log-info-repository = TABLE
relay-log-recovery = ON
sync-master-info = 1
sync-relay-log-info = 1

Let’s see what each of these settings does.

master-info-repository=TABLE and relay-log-info-repository=TABLE instruct mysql to store master and relay log information into the mysql database rather than in separated *.info files in the /var/lib/mysql folder.
This is important because in case of crashes, we would like to ensure that master/relay log information is subject to the same ACID properties that the database itself provides. Corollary: make sure the relevant meta tables have InnoDB as storage engine.
For example, a SHOW CREATE TABLE slave_master_info should say Engine=InnoDB.

relay-log-recovery=ON is critical in case of corruption of relay log files on a slave system. When MySQL encounters corrupted relay log files during startup, by default it will drop the ball and halt. This option set to ON, will cause mysql to attempt refetching the relay log files from the master database. The master should then be configured to keep its binlogs for a suitable amount of time (often I use 2 weeks, but really depends on the volume of database changes). As a test, it’s possible to replace the current relay log file with a corrupted copy (from /dev/urandom for example). MySQL will discard the corrupted log file and attempt download from the master, after which a regular startup will be carried out. Fully automatic recovery!

sync-master-info=1 and sync-relay-log-info=1 enable the synchronized commit of both master and relay log information to the database with every transaction commit. This is again something that must be evaluated in each single application. Most probably if you have a high volume of writes, you don’t want to enable it. However, if the writes rate is low enough, this option won’t cost any additional performance and should instead make sure that the slave_master_info and slave_relay_log_info tables are always consistent with the state of the replication and of the rest of the database.

That is all. I’d love to hear any feedback or corrections to this information.

The quest for a perfect keyboard — part 2

You might want to read episode 1 first, in which I started documenting my quest to find an excellent keyboard that matches me.

Filco Majestouch 2 Ninja TKL The keyboard I currently use at work is one I bought myself, a Filco Majestouch 2 TKL US layout, TKL meaning without the numeric keypad (so called Ten Key Less). In part one I said I was experiencing some strain in my left hand typically after a day of work or so.

That doesn’t happen anymore.

To understand why, I’ll go back a few months from now. I was reading
Twitter, and I noticed a message from a friend.

He wasn’t using his Kinesis keyboard, and asked if anyone was interested. He was basically giving away his Kinesis.

(here’s an interesting article involving another Kinesis)

Surprise!

We got in touch and Tim shipped his keyboard to Norway. I had
been playing with the thought of buying one for a while, but it seemed
too expensive and I was not convinced at all that I could learn to type on it comfortably.

Kinesis Advantage black keyboard

The very first time I plugged the keyboard in, I was at home (I mean I was literally at home), relaxed, very excited about learning how the Kinesis worked, where all the keys were located, and what was the hand-brain response. Everything went better than expected.

Next I brought the keyboard at work. That is when things started to
break down :-)

Kinesis at work

I’m slowly learning the Norwegian language. At work, where I spend most of the time, the “official” language is English. That means I don’t get a lot of practice for free, and it’s taking me a long time to become proficient.

When an opportunity to practice Norwegian comes up, I feel some resistance to use it because I suck at it. Add that English is more comfortable to use and everyone can understand it, and you have a good recipe to keep me from learning even longer :-)

Learning to type on a Kinesis is like speaking a new language. All the movements and keystrokes that are hardwired in your muscle memory suddenly cannot work anymore like you’re used to and you feel frustrated and helpless. I noticed I was at least 5-10 times slower than I was on my usual keyboard. This was the first week of usage.

Exercise!

The instruction manual for the Kinesis is something you definitely want to read and use. For many reasons. It explains how to activate many functions and special keys that otherwise you wouldn’t know how to.

More importantly, it warns you about this awkward reaction your body and fingers are going to have when you start using the keyboard and advices to perform some exercises to retrain your brain and muscle memory.

Those exercises are really effective, and after just a couple of days of doing them I saw a big difference in typing comfort and rate of errors. What I didn’t expect was to realize that they also help you type better no matter what keyboard you use. One of the key (ehm) lessons these exercises will teach you is when it’s better to use your left or right fingers.

For example, if I have to type # (the hash or square sign, on a US layout keyboard, upper symbol on the 3 key), I usually press the left SHIFT key with my pinky and then press 3 with my (left) middle finger.

The Kinesis manual strongly advices against that, and instead helps you learn to type # by depressing the right-side SHIFT instead with your right hand, and the 3 with your left hand. It will be much more comfortable and will result in much less strain after a long work session.

I guess here I just gave away that I’m no trained typist :-)
Oh well, that’s ok.

Back to black

Back to my (black) regular keyboard, I could really see that this way of typing helps in the long run, so I tried to practice it and now I find myself using these straining finger combinations a lot less.

But… what happened to the Kinesis then?

I learned to type decently on it, with an OK speed, still making more mistakes than I’d like, but at least not feeling frustrated. However, the Kinesis proved not to be the keyboard for me!

I truly believe it is an excellent keyboard. However, here’s my personal list of cons (beware, this is a nitpicky list):

  • function keys and all other keys on that row, including escape, are too small and close to each other and lack the same mechanical switch feel of the rest of the keyboard.
  • palm-rests are slightly too high, at least for me. I found them a bit uncomfortable.
  • no Control key on the right (or was it left?) side, so sometimes using the correct key combination takes either two keystrokes or must be done with the same hand instead of using (properly) two.

keyboard.io

I’ve been following Jesse Vincent’s blog for a while now, enough to know he’s a keyboard enthusiast (nerd?) and has been building a lot of keyboard prototypes, to find “The One”, and he went on to found the keyboard.io initiative.

That’s interesting, because following his posts, I can see that I am looking at exactly the same features and ergonomicity(?) when evaluating a keyboard for daily — programming — use.

Here’s the keyboard.io “00” model:

Keyboard.io Model 00. Copyright Jesse Vincent / keyboard.io

Keyboard.io Model 00. Photo courtesy Jesse Vincent / keyboard.io

It would be very interesting to try it. It’s not sold yet, so feedback can be limited to what I can see:

  • It’s clear that a lot of design and thought has gone into this keyboard, and it’s probably just right for Jesse that built it, so it can’t be any better from that point of view.
  • The use of wood instead of a more keyboardy material feels strange, like those “Diamond iPhone” products, or crocodile skin shoes or something like that. Maybe it’s awesome, but that’s how it feels to me.
  • Key placement seems to be the most compelling and studied feature of this keyboard. It seems to map actual hands and fingers closer than any other keyboard I’ve seen, including the ergonomic ones. It’s hard to imagine (without having one here with me at the moment :-) how to use the thumb, especially with the white key. That one seems to be right under the finger “body”. Not sure.
  • The “butterfly” shape doesn’t feel like professional to me. I wouldn’t associate it with a model that a keyboard nerd would want to buy. From the pictures it seems like the vertical (longitudinal) dimension is very large compared to the width. I guess it’s not a keyboard that people want to carry around too much :-)
  • I hope the cable is at least 1.5m in length. It’s never long enough.

That’s it for part 2.

I’m still sticking to the Filco for now! :-)

The quest for a perfect keyboard — part 1

I think I have become addicted to computer keyboards.

Maybe I always was, but I didn’t notice until about a year ago. Let’s go back in time a bit.

Year is 1981. I am about 6 years old. Not going to school yet,
in fact I would skip first grade and start straight in second. I must have been too adorable, so my mom didn’t want to let me go to school :-)

My dad brings home something that would change my life forever, some sort of toy. One of the first mass market home computers ever made. The Commodore VIC-20.

The computer *is* the keyboard. I think that is where
the magic started. Fast forward a few years, and I got
the C64, then the Amiga 500, the best home computer ever built:

Tried a few more (old) computer models in school, and then the second “strange” encounter.

My dad again :-) was trying to buy a computer powerful
enough to run some architectural CAD program, that only
came with PowerPC Macs series 6000 at the time.

That’s when I saw my first split keyboard.

Don’t know why, but it felt irresistibly attractive for me, subconsciously imprinting in my mind the link between split keyboards
and raw processing power :-)

Fast forward another few years when my then girlfriend,
about 15 years later still my wife, gave me a completely
unexpected and totally awesome gift:

A split keyboard, similar to the Microsoft Natural Elite,
the old model. I have been working on this very keyboard
ever since, for more than ten years. It has undergone
three or four full disassemblies and cleaning cycles.

Up to last year, when it started having the first aging
problems, particularly with the space bar that needed
a few hits to record a keystroke.

Not sure if I was more sad or more excited to start
searching for a replacement keyboard :-)

After a few days, I found what I think are the reference
communities for keyboard enthusiasts: GeekHack and Deskthority.

A month later I already had an IBM Model “M” scavenged
from a recycled electronics bin here at work, and having annoyed my
office colleagues with the buckling springs noise
for a couple of weeks, I finally went on to buy
myself this little gem:

This is a “Filco Majestouch Ninja 2 TKL” with US layout.
I’ve been using US layouts for my entire life more or less.

The Filco is a really good keyboard, very good build quality,
sturdy, heavy, awesome to look at and to work with.
A bit noisy, yes, I’m reminded every now and then :-)

After months of using the Filco, all I can say is that it’s
great, and I love working with it. If you map CAPS LOCK to
CTRL it’s even better.

I use it with awesomewm, so the Windows/Meta4 key is used a lot.
On some particularly long sessions, I can feel some strain on
my left hand fingers, pinky and thumb.

Which made me wonder whether I should go back to a split layout…

Stay tuned for part 2 – The search continues.

Display and filter traffic at the varnish level: vlogdump

Haven’t written much in the last few months. The reason is that I’ve been at work building the Opera Discover service backend, that we launched on Opera mobile for Android just a few days ago.

A few weeks before, during the first stress test sessions of Discover, I wrote this little tool called vlogdump that Opera allowed me to put up on github. The main purpose, besides learning awk :-) is to display and filter traffic coming into your varnish daemon..

vlogdump is not meant to replace varnishlog but I know that sometimes varnishlog gives me too much output to deal with, especially if I want to pinpoint a single client or a single request. I know that the varnishlog that ships with varnish 3.0.x is way better in this regard, but we’re using 2.1.x, and that version of varnishlog is not as capable.

vlogdump is easier to look at than varnishlog, but at the same time it conveys much more information than varnishncsa or the typical access.log format.

Here’s an example of output:

$ varnishlog | vlogdump -v only_misses=1
172.22.0.15 => GET /assets/e85ed0a7b1b87120a0a2bfa025531c6733a48802 HTTP/1.0 MISS
            <= 200 OK 28.432 ms 172.22.0.18 => GET /assets/5a9e9440c5c85e8dc5d65e03e15c95e390901fa7 HTTP/1.0 MISS
            <= 200 OK 36.905 ms 172.22.0.18 => GET /icons/categories/te/icon32x32-technology.png HTTP/1.0 MISS
            <= 304 Not Modified 0.589 ms 172.22.0.15 => GET /api/fetch/article-preview/?client=2&language=en-GB HTTP/1.1 MISS
            <= 301 MOVED PERMANENTLY 8.381 ms 172.22.0.18 => GET /assets/c3830e95b717761005e26ce49ebab253e0ccb40b HTTP/1.0 MISS
            <= 200 OK 291.354 ms 172.22.0.18 => GET /api/category?client=2&language=en-GB HTTP/1.1 MISS
            <= 200 OK 58.025 ms   ...

Another interesting example.

Show request and response headers of transactions that resulted in cache hits and had request headers (any of them) matching "Android":

$ varnishlog | vlogdump -v show_req_headers=1 -v show_resp_headers=1 -v req_headers_match=Android -v only_hits=1
83.149.37.122 => GET /api/category/?... HTTP/1.1 HIT
            <= 200 OK         0.088 ms
   req.http.Accept = application/json;version=1
   req.http.Accept-Encoding = gzip
   req.http.Host = ...opera.com
   req.http.Connection = Keep-Alive
   req.http.User-Agent = Mozilla/5.0 (Linux; Android 4.1.2; GT-N7100 Build/JZO54K) AppleWebKit/537.31 (KHTML, like Gecko) Chrome/26.0.1410.58 Mobile Safari/537.31 OPR/14.0.1074.57768
 
   beresp.http.Server = Apache
   beresp.http.Content-Encoding = gzip
   beresp.http.Content-Type = application/json
   beresp.http.Vary = Accept-Encoding, Origin
   beresp.http.Content-Length = 4217
   beresp.http.Date = Sat, 25 May 2013 07:59:53 GMT
   beresp.http.X-Varnish = 1611090407 1611007435
   beresp.http.Age = 267
   beresp.http.Via = 1.1 varnish
   beresp.http.Connection = keep-alive

Now that you're eager to try it :-), you can do so in a few commands, and assuming you have the right awk installed:

wget -q -Ovlogdump https://raw.github.com/cosimo/vlogdump/master/vlogdump
varnishlog | ./vlogdump [options]

The documentation lists all the available options.

You can do more interesting things:

  • display request or response headers for each transaction
    (-v show_req_headers=1, -v show_resp_headers=1)
  • show only requests slower than 200ms (vlogdump -v only_slow=200)
  • show only cache misses or hits (-v only_hits=1 or only_misses=1)
  • show only transactions where the URL matches regexp X
    (-v url_match='X' or -v url_match='!X' for negative match)
  • show only transactions where the HTTP status code was X
    (-v only_status=X)
  • show only transactions where the request or response headers match a given regular expression (-v req_headers_match=Blah, -v resp_headers_match=Error)

You can also combine most of these options together. That is very useful when you are interested in a small fraction of the traffic, but you want to see the whole in-flight transactions.

One recommendation though. It is my first (last?) significant awk script :-) I know it works well, and I'm using it, but due to the way it works, I wouldn't leave it running for long periods of time, as it will slowly eat your memory keeping track of all transactions and clients.

If you have feedback or questions, feel free to comment on github or send me an email.

Logging nagios remote commands

Quick trick, I needed it to debug execution of remote nagios commands.

Just drop this file into /var/nagios/.bashrc, assuming your local nagios user is configured to use the /bin/bash shell:

#!/bin/bash
#
# Log every command run by the nagios user
# into /var/log/auth.log (at least on Debian and derivatives)
#
trap 'logger -p auth.info -t nagios "Running $BASH_COMMAND"' DEBUG

The trap function executes a given command or list of commands when the list of signals specified as arguments are raised,
as in:

trap [COMMAND] [SIGNALS]

The DEBUG signal is special: it will fire every time a command is executed. Using logger ensures that whatever command the nagios user is trying to execute will be logged.

Last bit, how do you get the command text? It’s available in the $BASH_COMMAND variable.

Here’s an extract of the resulting log information:

Mar 30 10:48:05 big1 nagios: Running /usr/lib/nagios/plugins/check_cpu -i 5 -w 90 -c 98
Mar 30 10:49:42 big1 nagios: Running /usr/lib/nagios/plugins/check_tcp -p 3306
Mar 30 10:49:42 big1 nagios: Running /var/nagios/libexec/check_load -w40,40,40 -c50,50,50
Mar 30 10:50:26 big1 nagios: Running /usr/lib/nagios/plugins/check_procs -w 1:1 -c 1:1 -a /usr/sbin/cron
Mar 30 10:50:44 big1 nagios: Running /usr/lib/nagios/plugins/check_disk -w 20 -c 10 -r "^/(ssd|store[1-3])?$"
...

To learn more about traps, here’s a web search on “bash traps”.

Net::Statsd::Server, a Perl port of Flickr/Etsy’s statsd

If you’re looking for a Perl client to connect to a statsd daemon, checkout Net::Statsd on CPAN, now at version 0.08.

This post is about the server component of statsd.

Tracking metrics: up to now

The idea of statsd started in Flickr by Cal Henderson, and some code is still available, but it’s not very functional or complete.

Since reading about statsd, I found the concept brilliant. I have been using a similar technique long before hearing about statsd though. I learned it from colleagues here at Opera in 2008. They were using it to track application metrics for the Opera Link server. I thought it was great, so I also implemented it, extending it by making it very easy to add metrics and to see the output automatically in Munin. Here’s how it worked basically:

# ...
use Opera::Stats;
# ...
Opera::Stats::count("site.logins");
# ...

The project code would have typically tens or hundreds of these calls. Each call would store/increment a counter in a local or remote memcached. Then a complementary Opera::Stats::Munin module would automatically generate the output needed to implement a full Munin plugin given the metrics to be exposed.

So far, so good. Except there were a few things that didn’t work quite right:

  • Using TCP connections, maybe even to remote machines, even though it was never a problem, could be in case the memcached machines went down
  • Volume was a concern. I had to worry about tracking too many metrics. How would that affect functioning of memcached for regularly stored keys and values? Would those metrics-related keys cause evictions in the regular memcached content?
  • Even though the munin integration made it very easy to have charts, there were still some limitations: creating new charts requires some wrapper plugin with 1 or 2 lines of Perl code. Flexibility was also an issue.

Enter statsd

I have been thinking of replacing this system with statsd for a while. However, I wanted to have a more in-depth look at it before deploying it.

Turns out that statsd is a simple project, which I like, but requires nodejs. Knowing next to nothing about nodejs, I took some time to learn a few things.

I also realized I have been wanting to learn about AnyEvent for a long time.

Net::Statsd::Server

Two weeks ago, I spent a busy weekend reimplementing 95% of statsd in Perl. On Sunday night, I had a functional version of statsd written in Perl with AnyEvent.

AnyEvent stuff is surprising at times. I found especially interesting to debug the cases where your timer (AE::timer) doesn’t fire unless you actually save it to a scalar, as in:

# This won't fire!
AE::timer 10, 10, \&do_something;

# This will though.
# This behaviour is triggered by "defined wantarray"
my $t = AE::timer 10, 10, \&do_something;

Since that weekend, I have spent a few more nights tweaking Net::Statsd::Server. Yesterday I wrote a new piece of functionality (a new “File” backend) that is actually not in the original statsd.

It looks like I might need new backends as well, so I think it’s “an investment with a good ROI”, even though I did it mainly for fun and in my free time.

Performance

I wanted to make sure my statsd server implementation would be fast. I started by bringing up the nodejs statsd and firing my official benchmark script with 1 million iterations, and then comparing the results with my own statsd server.

That didn’t work out very well. Or rather, it worked out brilliantly, showing around 40K requests/s being handled by nodejs-statsd and 50K requests/s by Net::Statsd::Server. Problem is: how do you measure the performance of a UDP server? Or, for that matter, of a UDP client?

I figured out that, being UDP connection-less fire-and-forget, it doesn’t really matter how many packets/s the client fires, as long as you can generate more than your server can handle. Just as a data point, I reached around 73-75k statsd API calls per second (for the gauge API, around 55-58k for counters and timers). What really matters is how many packets reach the server.

BTW, I used another amazing piece of software called Devel::NYTProf to optimize the performance of the incoming packets code path as much as I could.

The test setup

To measure how many packets are received on the server-side, I prepared a test configuration:

{ graphitePort: 2003
, graphiteHost: "graphite.localdomain"
, host: "0.0.0.0"
, port: 8125
, backends: [ "./backends/graphite", "./backends/console" ]
, mgmt_address: "0.0.0.0"
, mgmt_port: 8126
}

The same configuration file for the Perl server becomes:

{ "graphitePort": 2003,
  "graphiteHost": "graphite.localdomain",
  "host" : "0.0.0.0",
  "port": 8125,
  "mgmt_address" : "0.0.0.0",
  "mgmt_port": 8126,
  "backends": [ "Graphite", "Console" ],
  "log" : {
    "backend" : "stdout",
    "level" : "LOG_WARN",
  }
}

Using the benchmark.pl code mentioned above, run with:

$ perl benchmark.pl 1000000

I started up first the nodejs statsd, then the Net::Statsd::Server daemon and captured their output. Both servers are configured to use their Graphite backend and flush to a valid and active graphite host. The Console backend is also active for both servers, so I could capture the output and look at the statsd.packets_received counter and directly measure how many packets are received in the server.

The benchmark utility with first argument = 1000000 generates 5 million statsd API calls, that is, 5 million UDP packets.

Of these 5 million packets, nodejs statsd was able to capture 2106768, 1596275, 1479145 and 1490640 packets over several runs.

Net::Statsd::Server, again in 3 different runs, was able to capture 2106242, 1884810, 1822042 and 1866500 packets.

I have performed more tests, and they had a very low deviation from the last runs (1.5M for etsy’s statsd and 1.8M for Net::Statsd::Server). Removing the 2 peak results of ~2.1Mb, it would seem that the Perl statsd is capable of receiving 22% more packets than the original statsd daemon written in javascript.

Of course, this is just my test. I have tried to run the test on different hardware, but I haven’t got significantly different results. If you try yourself, please let me know what numbers you get. I’d be curious to know :-)

SO_RCVBUF

Given the massive amount of UDP packets that were lost in the tests (50%+ in the best runs), I tried to figure out a way to improve this and I stumbled on SO_RCVBUF.

My understanding was that bumping up SO_RCVBUF on the listening UDP socket would dramatically decrease packet loss. However, I hadn’t been able to prove the theory because I hadn’t seen an improvement in the total number of packets received. At least until I read this article on UDP packet loss on stackoverflow.com, that pointed me to the net.core.rmem_max sysctl.

After modifying net.core.rmem_max, setting it to 100M, just to avoid its effect, and using the following code in Net::Statsd::Server:

# Bump up SO_RCVBUF on UDP socket, to buffer up incoming
# UDP packets, to avoid massive packet loss when load is very high.
setsockopt($self->{server}->fh, SOL_SOCKET, SO_RCVBUF, 1*1024*1024)
or die "Couldn't set SO_RCVBUF: $!";

I can see some very interesting effect.

Re-running the node.js statsd, I could see an increased amount of captured packets (1691700, 1675902, ~10% increase).
Running again the Net::Statsd::Server daemon, I recorded 2678507 and 2477246 packets, for an impressive ~40% increase!

As a last effort, I tried varying the SO_RCVBUF size from 1 to 64Mb to see what effect it had on the amount of captured packets (or UDP packet loss if you prefer).

I haven’t run any scientific set of tests, but I can’t see any statistically significant increase for values greater than 4-8Mb, so I haven’t decided where to set the default in Net::Statsd::Server yet. Any chosen value is likely to need specific sysctl tuning anyway, so YMMV.

Why?

Did I really do it for fun? Yes, mainly, but also because:

  • I don’t like adding node.js to our production stack just to run statsd. I have never operated a node.js server, so I don’t want to take this “risk”. The product we’re building is going live soon! :-) And note that this does apply to anything, it’s not about node.js per se :-)
  • to learn how statsd was put together
  • to learn AnyEvent
  • to learn how to build a high performance UDP server
  • Basically, to learn :-)

Code is up on CPAN, as usual: https://metacpan.org/module/Net::Statsd::Server.

If you happen to use it, please give me some feedback!
Using Perl and Google Chromium’s CLD to identify the language of a text

For a new project I'm working on, given a body of text, I need to identify which language it's written in (English, Russian, Chinese, etc…).

I'm not exactly the first person on Earth to do this, so it turns out there's Google's CLD library. Surprisingly, several people around here didn't know it. The library is open source and very good too, so I immediately looked for Perl bindings for it.

There is a great Perl module on CPAN called Lingua::Identify::CLD. This module bundles a copy of the CLD library, and fully automates build and link steps too. So I gave it a shot.

How to use Lingua::Identify::CLD

It's amazingly easy to use. Here's a sample of the code:


#!/usr/bin/perl

use strict;
use Lingua::Identify::CLD ();

my $text;
while (readline) { $text .= $_ }
chomp $text;

# In my case, the content is HTML
my $cld = Lingua::Identify::CLD->new(isPlainText => 0);

# Example: (ENGLISH, en, 64)
my @lang = $cld->identify($text);
say "Language: $lang[0]";

Failing tests

I decided to start using this module into my project. The build phase went fine (perl ./Build), while the tests were failing (./Build test). Here's the log of a failed test run:


$ ./Build test
cc -I/usr/lib/perl/5.14/CORE -fPIC -c -D_REENTRANT -D_GNU_SOURCE -DDEBIAN -fstack-protector -fno-strict-aliasing -pipe -I/usr/local/include -D_LARGEFILE_SOURCE -D_FILE_OFFSET_BITS=64 -O2 -g -o /tmp/gAc_glZta2/library.o /tmp/gAc_glZta2/library.c
cc -I/usr/lib/perl/5.14/CORE -fPIC -c -D_REENTRANT -D_GNU_SOURCE -DDEBIAN -fstack-protector -fno-strict-aliasing -pipe -I/usr/local/include -D_LARGEFILE_SOURCE -D_FILE_OFFSET_BITS=64 -O2 -g -o /tmp/gAc_glZta2/test.o /tmp/gAc_glZta2/test.c
cc -shared -L/usr/local/lib -fstack-protector -o /tmp/gAc_glZta2/libfoo.so /tmp/gAc_glZta2/library.o
cc -fstack-protector -L/usr/local/lib -o /tmp/gAc_glZta2/foo /tmp/gAc_glZta2/test.o -L/tmp/gAc_glZta2 -lfoo

** Preparing XS code
t/00-load.t ....... 1/1 Bailout called.  Further testing stopped:  

#   Failed test 'use Lingua::Identify::CLD;'
#   at t/00-load.t line 6.
#     Tried to use 'Lingua::Identify::CLD'.
#     Error:  Not a CODE reference at /usr/lib/perl/5.14/DynaLoader.pm line 207.
# END failed--call queue aborted at .../Lingua-Identify-CLD-0.05/blib/lib/Lingua/Identify/CLD.pm line 207.
# BEGIN failed--compilation aborted at .../Lingua-Identify-CLD-0.05/blib/lib/Lingua/Identify/CLD.pm line 24.
# Compilation failed in require at (eval 4) line 2.
# BEGIN failed--compilation aborted at (eval 4) line 2.
Use of uninitialized value $Lingua::Identify::CLD::VERSION in concatenation (.) or string at t/00-load.t line 9.
# Testing Lingua::Identify::CLD , Perl 5.014002, /usr/bin/perl
# Looks like you failed 1 test of 1.
FAILED--Further testing stopped.

Just the day before I had successfully compiled and run the tests for the same version of the module, but on Ubuntu 11.10, which I was using. Then I decided to upgrade to 12.10, and that's where I got this failed test run.

Contacting the author

Then I decided to contact the author of the module. Being Alberto quite a known author, with lots of CPAN contributions, I hoped he would answer my query within 2-3 days. That would give me some time to do other stuff, and hopefully would give him time to analyze the failure.

As usual with the best CPAN authors ;-) he answered in a couple of hours, which was fantastic for me. He had already identified a few failures like mine thanks to another awesome resource we have in the Perl community, the CPAN Testers service.

CPAN Testers

CPAN testers is a group of users that regularly (or not) report back the build/test status of everything that's released to CPAN in a multitude of platforms and versions of Perl. I think this is one of the most underestimated awesome features we have in the Perl community. The CPAN testers status of Lingua::Identify::CLD shows one report that looks exactly the same as the failure I experienced. This is on Ubuntu 12.10 with the stock perl 5.14.2.

The ugly patch

I tried to analyze the problem, apparently located in DynaLoader, and came up with a shotgun-debugging-driven patch that I copy/paste here for reference:

@@ -18,10 +18,23 @@ Version 0.05

 our $VERSION = '0.05';
 
-use XSLoader;
-BEGIN {
+eval {
+
+    require XSLoader;
     XSLoader::load('Lingua::Identify::CLD', $VERSION);
-}
+
+} or do {
+
+    # This warning triggers on Ubuntu 12.10 with the
+    # stock perl 5.14.2. Strangely enough, this doesn't
+    # seem to affect the tests at all.
+    #
+    # Not a CODE reference at /usr/lib/perl/5.14/DynaLoader.pm line 207.
+    # END failed--call queue aborted at .../blib/lib/Lingua/Identify/CLD.pm line 207.
+    # ) at .../blib/lib/Lingua/Identify/CLD.pm line 28."
+    #
+    #warn "Something's wrong with XSLoader? ($@)";
+};
 
 =head1 SYNOPSIS

It's shotgun debugging because I don't really know what's going on, I just came up with this patch because of the assumptions and information I gathered during the years on how DynaLoader/XSLoader and BEGIN {} blocks work or interact with the rest of the code :-)

Anyway, it makes the tests pass again, even with a weird warning. I agree with Alberto that it's not wise to incorporate this patch into Lingua::Identify::CLD, until we have understood why the original code fails, and why just for 2 people in the world.

All this blah-blah, to say: please do help! If you have seen the same problem, help us figure out what it is. My repository with the forked/patched code is on Github:

https://github.com/cosimo/Lingua-Identify-CLD

Have fun!

My first attempt at a responsive layout: OSQA

The so called responsive layouts are all the rage these days, and frankly, I feel ashamed that some of my personal projects I do at home are not responsive yet. Partly that's because I don't have that much spare time to dedicate to them, but partly it's also because I have no idea how to transform a "fixed" or traditional layout into a responsive one.

I tried to remedy this by studying a few responsive layouts I stumbled upon. However, I didn't find it very easy to just stare at the code and understand what's going on. Modern CSS has quite some dose of magic for me. I searched a bit around the web to find some responsive layout guides and tried to read them. I remembered we must have had quite some information on responsive layouts on Dev Opera.

A search for "responsive" turns up lots of good results, including Love your devices: adaptive web design with media queries and more… by colleague Chris Mills.

Recently I heard that Chris published the "Practical CSS 3" book, so I just dived into the article, eager to learn everything about responsive layouts, adapting to devices, etc… The occasion for it is another tiny personal project I'm working on during nights and weekends.

It's yet another stack-overflow clone, but for parenting, newborns, pregnancy, etc… powered by the open source Q&A software OSQA. I'm in the process of splitting the existing web site with articles, comments, questions and answers into two different sites, a pure blog with articles and comments, and another site with just questions and answers. The latter is what I'm talking about in this article.

When you install OSQA, by default it looks like this:

It's not bad, but I like the default stack-overflow layout much better. So I spent a few days learning about OSQA and importing the existing content. I found it robust and well designed. It has everything I need, including themes or skins that you can build, and a custom-css functionality:
you can stack your custom CSS content on top of the selected skin, much like what we have in My Opera too.

After a bit of CSS fiddling, I came up with the following layout:

Unfortunately, the default OSQA layout is not responsive at all, and it looks terrible on mobile devices (initial-scale, anyone?). So I started this journey into unknown territory, guided by Chris Mills' article, to discover how to make a layout responsive from scratch. Now, I'm sure there's a crapload of useless/harmful stuff in my custom CSS, but the final result left me really satisfied:

… apart from the "Cerca"/Search button and a few minor things. In the end, I had to duplicate the default skin to make a few very small changes, but apart from that, all the rest is accomplished by the custom CSS snippet. Here it is. Of course the heart of it is the media query for mobile devices:

Please tell me where I screwed up, KTHXBYE :-)

Displaying realtime memcached traffic on a backend

Sometimes I like to write down posts like this, to remind myself how to do something, sort of a mental note.
Suppose you have a few application servers that use 1+ memcached servers, and you want some way to display the outbound traffic, providing some insights on what are the most used keys, counters, etc…

Here's a quick way to do that, assuming you're using the memcached text protocol:

tcpflow -ce dst port 11211 
    | cut -b53- 
    | grep ^get 
    | pipestat --clear --runtime 60 --field 2 --time 1 --limit 40

What this does is:

  • Use tcpflow to capture all outbound traffic to destination port 11211, default memcached port.
  • Remove the first 53 bytes from each line, to filter out source and destination ip/ports
  • Only display get requests (alternatively, use set, incr, …)
  • Feed the resulting data to pipestat, a simple but great Perl tool that aggregates the data, displaying the most frequent ones. The specific options I used are good if you want to display quick statistics like other tools as top, mytop, or varnishstat.

It goes without saying that these tools are automatically installed on all servers that our Devops team here at Opera manages. I couldn't work without them :)