Tag Archives: webops

SREcon EMEA 2022 Logo

My experience at SREcon EMEA 2022

A couple of weeks ago I attended SREcon EMEA in Amsterdam. Here’s some sparse thoughts about it, with no pretense of being exhaustive or coherent.

Looking Back

There are only a handful of conferences I’ve attended where I felt “at home”. Going back in time, Surge was the first one, then came Velocity. I’m adding SREcon to that list. It definitely felt like I was among people that speak the same language and have similar breadth and depth of expertise, and yet it is somewhat strange at the same time.

As I see it, there’s at least three “tiers” for such a big and niche conference. The FAANG folks, the tiny company with a sysadmin or devops or two, and then the big ocean of mid-sized companies, where people like us are. Our SRE team is four people and we manage a service with millions of monthly users. Needless to say, we have a lot on our plate :-)

I came to SREcon after a hiatus from conferences for some years. After a while, conferences tend to become self-referential and people start talking about the same things over and over again. I wanted to understand how things had changed in our field, what were people talking the most about, get some fresh perspectives and perhaps connect with people from other companies. What prompted me to do this was Niall Murphy tearing the SRE bible book apart.

The Question of SRE Identity

This year’s conference topic was “What could SRE be?”.
No surprise, then, that a good portion of the talks were about what I refer to as the question of identity for SREs. We have seen the same happen — and a lot more during all these years — for the DevOps movement.

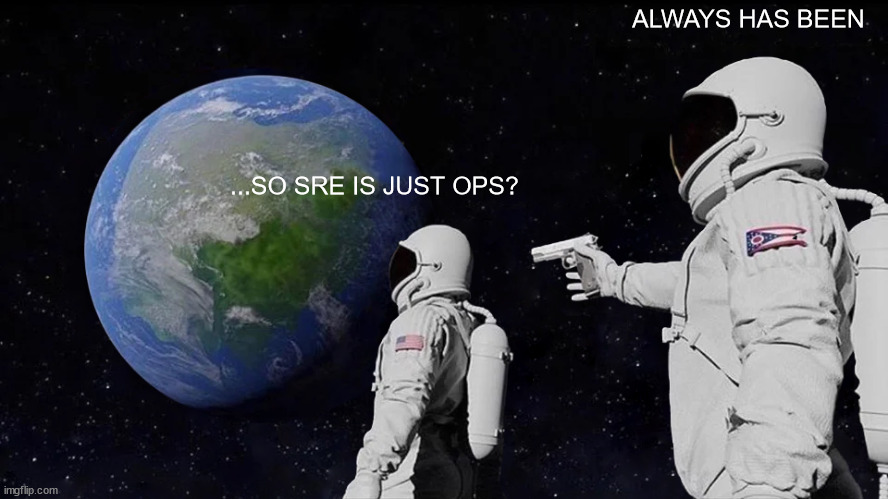
What could SRE be, then? According to some presentations, one would conclude that whatever SRE is, it’s no longer what Google intended, it’s not what anyone else thinks it is either, it’s just what you think it is: a subjectivist view.

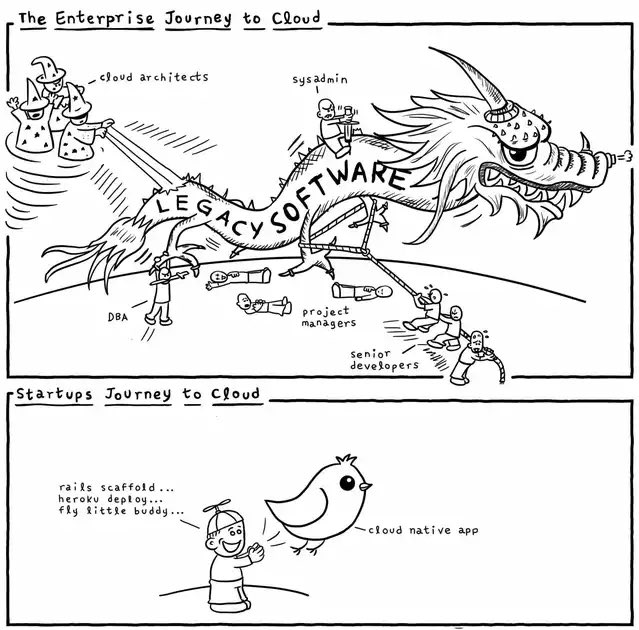
Among the Usenix slack conversations, there was a lot of chit-chat about SRE identity. My personal contribution was the following meme:

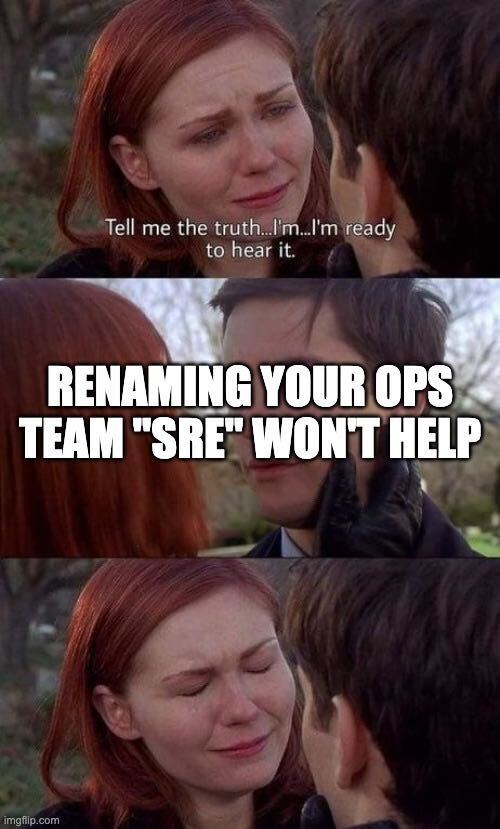
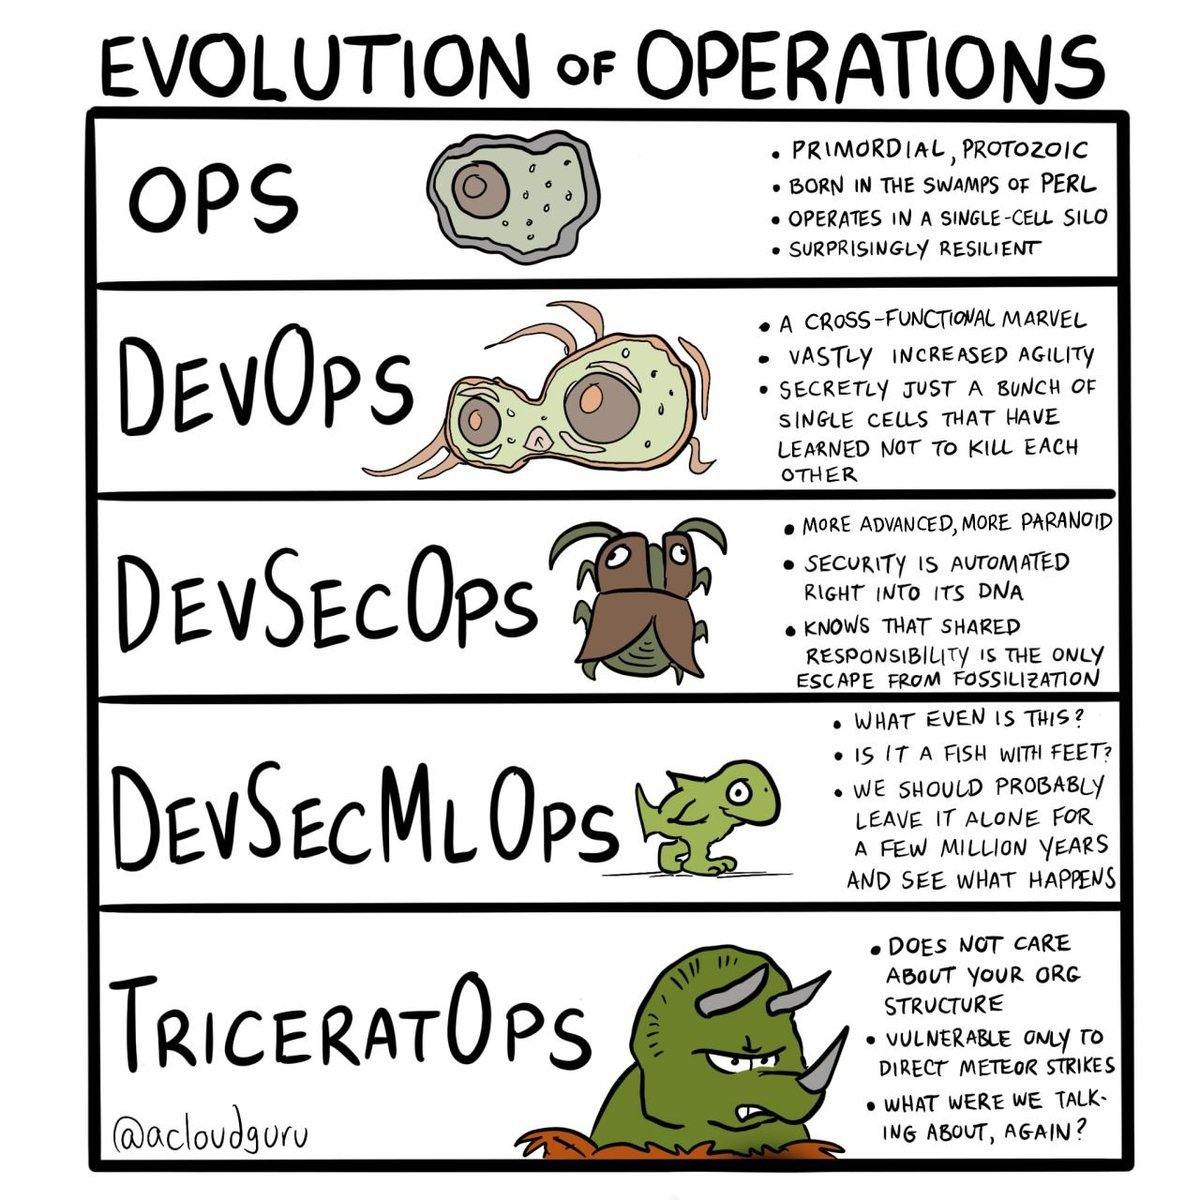
Other funny memes that were shared:

An interesting fact I learned during the conference is that the Google SRE book was written by assembling contributions from the best teams at Google, picking out their respective best practices. Paradoxically, this implies that the SRE book is not representative of how even Google itself does SRE. If you also consider that, at the time the SRE book was published (2016), Google employed about 1,200 people in the various SRE teams, the only possible conclusion is… if you are not Google, there is likely very little that you can apply to your everyday mere-mortal-SRE life.

Before you think I’m exaggerating, such conclusion was claimed by (ex-)Google engineers themselves, for example in Alex Hidalgo’s “Diamonds under Pressure” talk and (in my opinion) in one of the best talks of the conference, Emil Stolarsky’s Unified Theory of SRE. Another entertaining presentation in the same vein was Andrew Clay Shafer’s “SRE as She Is Spoke”. Andrew expressed this thesis that “progress [on the SRE journey] stops when the needs are met”, which seems a reasonable and pragmatic approach.
The videos are not up yet, but they should be in a few weeks.

Alongside to the “subjectivist” view, there were other talks, which could be classified as systems thinking, that focused on the more general and broad aspects of what SREs do, how to handle complex systems, human factors, etc… Among the best IMO were:

What else?

The question of SRE identity accounted for a notable part of the talks, but thankfully not all. It’s good to pause and reflect on our role, but personally that’s not why I was interested in SREcon, not primarily at least. What I like are the deep technical talks, where I get to know more about how other companies actually do the stuff we call SRE. Given my past conference experience, I expected Facebook/Meta’s talk to be somewhat disappointing, and it was. While some details of how Meta is structured were shared, and are always interesting, I expected a bit more on how the incident actually happened.

I loved Effie Mouzeli’s talk on how to make teams resilient, “Is Our Team as Resilient as Our Systems?”. We naturally focus on systems, but teams are a crucial part of the equation. My team and I have had to work on this a lot in the past years, and I’m hoping to share more about this soon. I felt this talk had a lot of good insights, some of which we’ve also applied over time.

Another talk that deserves a mention is Chris Sinjakli’s reflection on broadening the scope of how we work on reliability for our systems. This is sometimes difficult to do when toil is a big part of our jobs. Luckily it’s not for our team, not anymore at least, so this talk felt very relevant to me, and I recommend it.

I couldn’t attend some of the talks due to the two parallel tracks. I hope to catch-up when slides and videos will be published later on.

What about the hallway track?

In general, people say that conferences are most useful because of the casual conversations you can have in the hallways. While I do agree with it, the opportunities to have conversations vary depending on the type of person you are, and the people you meet, of course. My impression is that while some people at SREcon were happy to have conversations, most were likewise happy to be left alone, which is fair enough :-)
Just to say that it was really nice to meet people and chat, and almost all I talked to knew Kahoot! directly and were happy to share details about what they’re doing and equally interested in what we’re doing.

In some of these conversations I’ve been trying to motion for more concrete, down to earth, talks on how smaller companies like ours do SRE. It’s ok to aspire or be interested in how Google runs, but you come away with absolutely zero information that’s useful to your work life. Possibly there’s a downside even: people going home thinking they have to do whatever Google does (see chapters above) so ultimately… let’s give less importance to the Googles of the world, please!

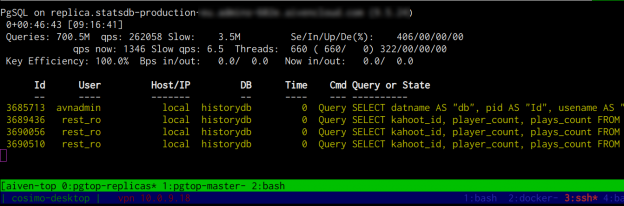
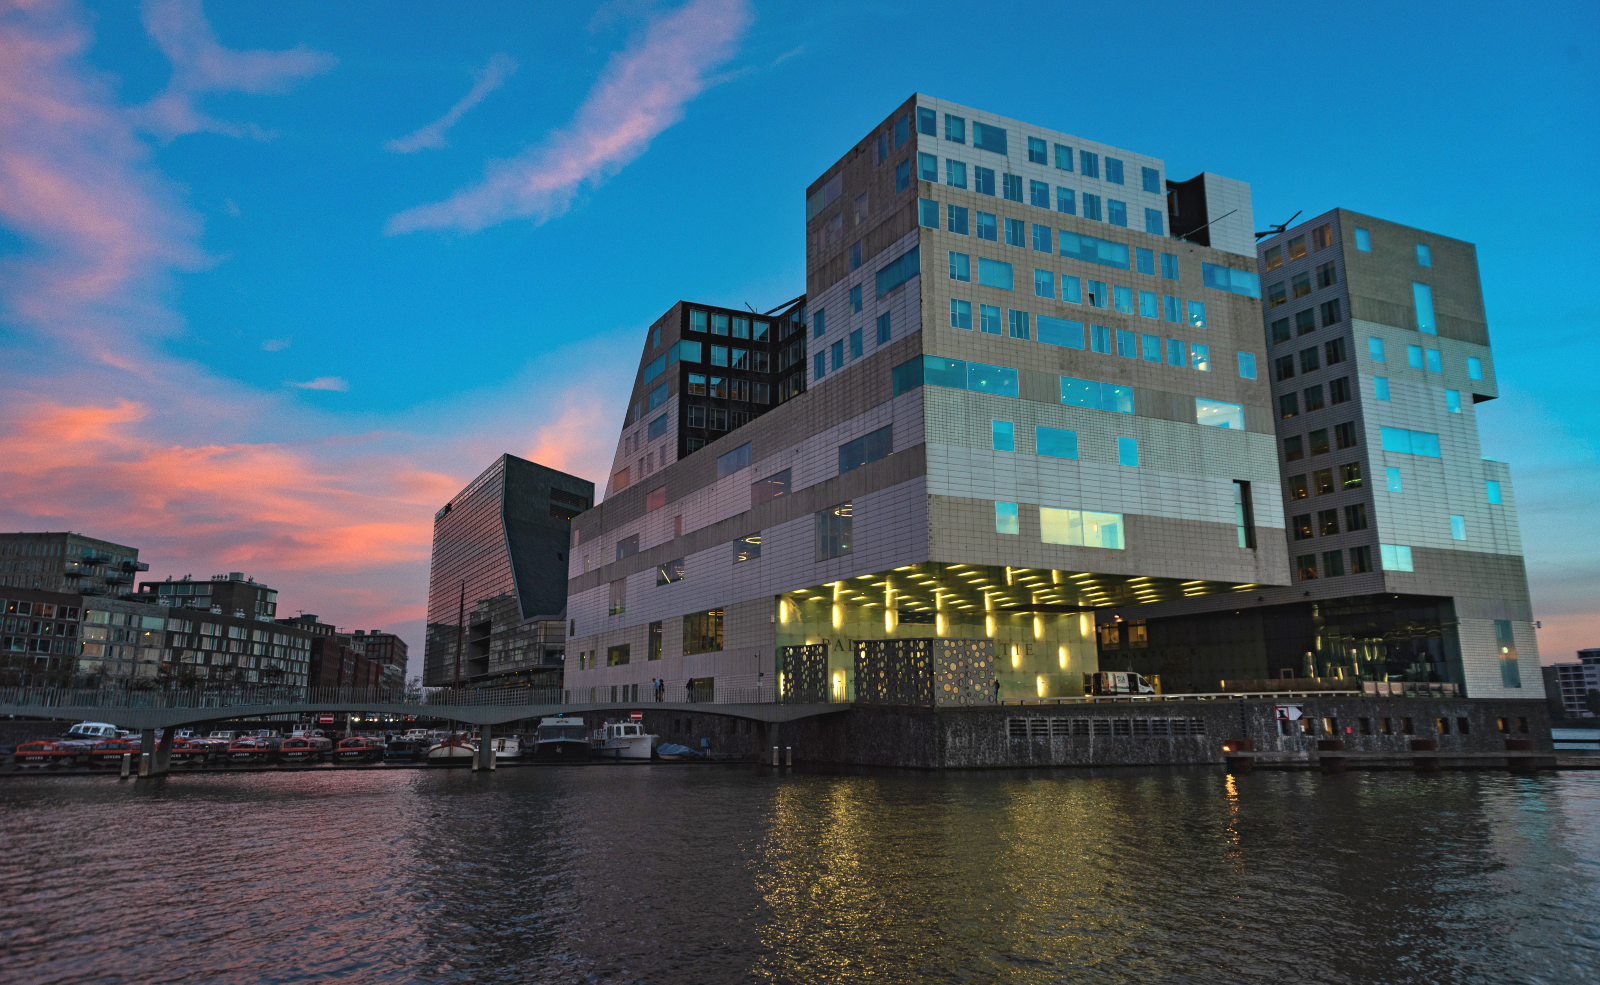
Besides the hallway track, there was a nice “sidewalk” track. We walked around the city, 15 km a day on average — you gotta track those SLOs… — and I also managed to snap some nice pictures of Amsterdam at sunrise and sunset.

The Venue and Organization

Loved all of it, honestly the best conference I’ve ever been to. The venue was spectacular, there was plenty of space, slides were clearly visible on screen, and the food was awesome! We also used one of the available meeting rooms to participate in our own company hackaton after the conference finished, until they kicked us out. Here’s a sneak peek of what our team was working on:

I hope to return to SREcon next year in Dublin. By then, I’d love to see more not-Google, not-Meta, etc… talks on the program. Perhaps we (or you!) should think about presenting too, why not?

pgtop – a top clone for PostgreSQL

According to meta::cpan records, the first release of pgtop is dated April 26, 2005, which makes this little software more than 15 years old!

Back then I had just found out about the brilliant mytop by Jeremy Zawodny, and my day-to-day experience being on Postgres, IIRC version 6.5.3, I decided to try and “convert” mytop to Postgres.

Being quite naive, I thought the endeavour would be much easier than it really was. I’m glad I started though, which is why pgtop exists in the first place. It’s not the only one either. I seem to remember a few similar pgtop projects by other programmers.

After using MySQL and Percona Server for many years, due to a new job, I have gone back to Postgres, version 9.5 and 10 at this time. In recent months, I have done some work to improve performance of our database queries, and remembered writing and using pgtop years before.

Since I lost(*) the original sources, I tried the pgtop version I last uploaded to CPAN, 0.05, dated 2008. It did work, in the sense that I could run the same perl code unmodified, a great testament to Perl as language and as runtime. It didn’t work because the underlying Postgres meta tables that were used in version 6 changed their schema in the 10-12 years since :-)

I spent some time to adapt the metadata queries to work with recent Postgres versions, and was slightly amused by the quality of my 15 year old code… The best feeling about this little tool was to rediscover how useful a few dozen lines of code can be. The service provider monitoring helps, but doesn’t even come close to the level of detail pgtop can provide.

After getting pgtop to work again, I quickly added a few more useful features. I was pleased by the efficiency with which I could work on this tool, considering its age.

So far I added just what was strictly necessary to me:

  • Updated pgtop to the current decade. Now requires perl >= 5.014
  • Fixed to work with Postgres >= 9.0
  • Added a sample Dockerfile to build and run pgtop as Docker container
  • Added a --config option, to load arbitrary config files. This is useful if you want to monitor several databases at once, for example in a tmux session. The config file supports all the options that are available on the command line.
  • Implemented a query killer command, activated pressing K to kill at once all queries slower than a given threshold, in seconds. This is useful if the database is overwhelmed by a lot of slow queries. I don’t recommend using it, particularly if it involves killing UPDATE or INSERT queries, but it can be quite useful.
  • Added a --slow_threshold option, to consider queries slow if they have been running for longer than the given value (in seconds). Now the tool highlights slow queries in bold yellow, and logs all the slow queries to a pgtop.log file.
  • Added a --slack_webhook option, to automatically notify a slack channel if a query crosses the slow threshold runtime value. All the information about the slow query including the SQL will be included in the slack message.

Please let me know if you give it a try! :-)

Display and filter traffic at the varnish level: vlogdump

Haven’t written much in the last few months. The reason is that I’ve been at work building the Opera Discover service backend, that we launched on Opera mobile for Android just a few days ago.

A few weeks before, during the first stress test sessions of Discover, I wrote this little tool called vlogdump that Opera allowed me to put up on github. The main purpose, besides learning awk :-) is to display and filter traffic coming into your varnish daemon..

vlogdump is not meant to replace varnishlog but I know that sometimes varnishlog gives me too much output to deal with, especially if I want to pinpoint a single client or a single request. I know that the varnishlog that ships with varnish 3.0.x is way better in this regard, but we’re using 2.1.x, and that version of varnishlog is not as capable.

vlogdump is easier to look at than varnishlog, but at the same time it conveys much more information than varnishncsa or the typical access.log format.

Here’s an example of output:

$ varnishlog | vlogdump -v only_misses=1
172.22.0.15 => GET /assets/e85ed0a7b1b87120a0a2bfa025531c6733a48802 HTTP/1.0 MISS
            <= 200 OK 28.432 ms 172.22.0.18 => GET /assets/5a9e9440c5c85e8dc5d65e03e15c95e390901fa7 HTTP/1.0 MISS
            <= 200 OK 36.905 ms 172.22.0.18 => GET /icons/categories/te/icon32x32-technology.png HTTP/1.0 MISS
            <= 304 Not Modified 0.589 ms 172.22.0.15 => GET /api/fetch/article-preview/?client=2&language=en-GB HTTP/1.1 MISS
            <= 301 MOVED PERMANENTLY 8.381 ms 172.22.0.18 => GET /assets/c3830e95b717761005e26ce49ebab253e0ccb40b HTTP/1.0 MISS
            <= 200 OK 291.354 ms 172.22.0.18 => GET /api/category?client=2&language=en-GB HTTP/1.1 MISS
            <= 200 OK 58.025 ms   ...

Another interesting example.

Show request and response headers of transactions that resulted in cache hits and had request headers (any of them) matching "Android":

$ varnishlog | vlogdump -v show_req_headers=1 -v show_resp_headers=1 -v req_headers_match=Android -v only_hits=1
83.149.37.122 => GET /api/category/?... HTTP/1.1 HIT
            <= 200 OK         0.088 ms
   req.http.Accept = application/json;version=1
   req.http.Accept-Encoding = gzip
   req.http.Host = ...opera.com
   req.http.Connection = Keep-Alive
   req.http.User-Agent = Mozilla/5.0 (Linux; Android 4.1.2; GT-N7100 Build/JZO54K) AppleWebKit/537.31 (KHTML, like Gecko) Chrome/26.0.1410.58 Mobile Safari/537.31 OPR/14.0.1074.57768
 
   beresp.http.Server = Apache
   beresp.http.Content-Encoding = gzip
   beresp.http.Content-Type = application/json
   beresp.http.Vary = Accept-Encoding, Origin
   beresp.http.Content-Length = 4217
   beresp.http.Date = Sat, 25 May 2013 07:59:53 GMT
   beresp.http.X-Varnish = 1611090407 1611007435
   beresp.http.Age = 267
   beresp.http.Via = 1.1 varnish
   beresp.http.Connection = keep-alive

Now that you're eager to try it :-), you can do so in a few commands, and assuming you have the right awk installed:

wget -q -Ovlogdump https://raw.github.com/cosimo/vlogdump/master/vlogdump
varnishlog | ./vlogdump [options]

The documentation lists all the available options.

You can do more interesting things:

  • display request or response headers for each transaction
    (-v show_req_headers=1, -v show_resp_headers=1)
  • show only requests slower than 200ms (vlogdump -v only_slow=200)
  • show only cache misses or hits (-v only_hits=1 or only_misses=1)
  • show only transactions where the URL matches regexp X
    (-v url_match='X' or -v url_match='!X' for negative match)
  • show only transactions where the HTTP status code was X
    (-v only_status=X)
  • show only transactions where the request or response headers match a given regular expression (-v req_headers_match=Blah, -v resp_headers_match=Error)

You can also combine most of these options together. That is very useful when you are interested in a small fraction of the traffic, but you want to see the whole in-flight transactions.

One recommendation though. It is my first (last?) significant awk script :-) I know it works well, and I'm using it, but due to the way it works, I wouldn't leave it running for long periods of time, as it will slowly eat your memory keeping track of all transactions and clients.

If you have feedback or questions, feel free to comment on github or send me an email.

Logging nagios remote commands

Quick trick, I needed it to debug execution of remote nagios commands.

Just drop this file into /var/nagios/.bashrc, assuming your local nagios user is configured to use the /bin/bash shell:

#!/bin/bash
#
# Log every command run by the nagios user
# into /var/log/auth.log (at least on Debian and derivatives)
#
trap 'logger -p auth.info -t nagios "Running $BASH_COMMAND"' DEBUG

The trap function executes a given command or list of commands when the list of signals specified as arguments are raised,
as in:

trap [COMMAND] [SIGNALS]

The DEBUG signal is special: it will fire every time a command is executed. Using logger ensures that whatever command the nagios user is trying to execute will be logged.

Last bit, how do you get the command text? It’s available in the $BASH_COMMAND variable.

Here’s an extract of the resulting log information:

Mar 30 10:48:05 big1 nagios: Running /usr/lib/nagios/plugins/check_cpu -i 5 -w 90 -c 98
Mar 30 10:49:42 big1 nagios: Running /usr/lib/nagios/plugins/check_tcp -p 3306
Mar 30 10:49:42 big1 nagios: Running /var/nagios/libexec/check_load -w40,40,40 -c50,50,50
Mar 30 10:50:26 big1 nagios: Running /usr/lib/nagios/plugins/check_procs -w 1:1 -c 1:1 -a /usr/sbin/cron
Mar 30 10:50:44 big1 nagios: Running /usr/lib/nagios/plugins/check_disk -w 20 -c 10 -r "^/(ssd|store[1-3])?$"
...

To learn more about traps, here’s a web search on “bash traps”.

Net::Statsd::Server, a Perl port of Flickr/Etsy’s statsd

If you’re looking for a Perl client to connect to a statsd daemon, checkout Net::Statsd on CPAN, now at version 0.08.

This post is about the server component of statsd.

Tracking metrics: up to now

The idea of statsd started in Flickr by Cal Henderson, and some code is still available, but it’s not very functional or complete.

Since reading about statsd, I found the concept brilliant. I have been using a similar technique long before hearing about statsd though. I learned it from colleagues here at Opera in 2008. They were using it to track application metrics for the Opera Link server. I thought it was great, so I also implemented it, extending it by making it very easy to add metrics and to see the output automatically in Munin. Here’s how it worked basically:

# ...
use Opera::Stats;
# ...
Opera::Stats::count("site.logins");
# ...

The project code would have typically tens or hundreds of these calls. Each call would store/increment a counter in a local or remote memcached. Then a complementary Opera::Stats::Munin module would automatically generate the output needed to implement a full Munin plugin given the metrics to be exposed.

So far, so good. Except there were a few things that didn’t work quite right:

  • Using TCP connections, maybe even to remote machines, even though it was never a problem, could be in case the memcached machines went down
  • Volume was a concern. I had to worry about tracking too many metrics. How would that affect functioning of memcached for regularly stored keys and values? Would those metrics-related keys cause evictions in the regular memcached content?
  • Even though the munin integration made it very easy to have charts, there were still some limitations: creating new charts requires some wrapper plugin with 1 or 2 lines of Perl code. Flexibility was also an issue.

Enter statsd

I have been thinking of replacing this system with statsd for a while. However, I wanted to have a more in-depth look at it before deploying it.

Turns out that statsd is a simple project, which I like, but requires nodejs. Knowing next to nothing about nodejs, I took some time to learn a few things.

I also realized I have been wanting to learn about AnyEvent for a long time.

Net::Statsd::Server

Two weeks ago, I spent a busy weekend reimplementing 95% of statsd in Perl. On Sunday night, I had a functional version of statsd written in Perl with AnyEvent.

AnyEvent stuff is surprising at times. I found especially interesting to debug the cases where your timer (AE::timer) doesn’t fire unless you actually save it to a scalar, as in:

# This won't fire!
AE::timer 10, 10, \&do_something;

# This will though.
# This behaviour is triggered by "defined wantarray"
my $t = AE::timer 10, 10, \&do_something;

Since that weekend, I have spent a few more nights tweaking Net::Statsd::Server. Yesterday I wrote a new piece of functionality (a new “File” backend) that is actually not in the original statsd.

It looks like I might need new backends as well, so I think it’s “an investment with a good ROI”, even though I did it mainly for fun and in my free time.

Performance

I wanted to make sure my statsd server implementation would be fast. I started by bringing up the nodejs statsd and firing my official benchmark script with 1 million iterations, and then comparing the results with my own statsd server.

That didn’t work out very well. Or rather, it worked out brilliantly, showing around 40K requests/s being handled by nodejs-statsd and 50K requests/s by Net::Statsd::Server. Problem is: how do you measure the performance of a UDP server? Or, for that matter, of a UDP client?

I figured out that, being UDP connection-less fire-and-forget, it doesn’t really matter how many packets/s the client fires, as long as you can generate more than your server can handle. Just as a data point, I reached around 73-75k statsd API calls per second (for the gauge API, around 55-58k for counters and timers). What really matters is how many packets reach the server.

BTW, I used another amazing piece of software called Devel::NYTProf to optimize the performance of the incoming packets code path as much as I could.

The test setup

To measure how many packets are received on the server-side, I prepared a test configuration:

{ graphitePort: 2003
, graphiteHost: "graphite.localdomain"
, host: "0.0.0.0"
, port: 8125
, backends: [ "./backends/graphite", "./backends/console" ]
, mgmt_address: "0.0.0.0"
, mgmt_port: 8126
}

The same configuration file for the Perl server becomes:

{ "graphitePort": 2003,
  "graphiteHost": "graphite.localdomain",
  "host" : "0.0.0.0",
  "port": 8125,
  "mgmt_address" : "0.0.0.0",
  "mgmt_port": 8126,
  "backends": [ "Graphite", "Console" ],
  "log" : {
    "backend" : "stdout",
    "level" : "LOG_WARN",
  }
}

Using the benchmark.pl code mentioned above, run with:

$ perl benchmark.pl 1000000

I started up first the nodejs statsd, then the Net::Statsd::Server daemon and captured their output. Both servers are configured to use their Graphite backend and flush to a valid and active graphite host. The Console backend is also active for both servers, so I could capture the output and look at the statsd.packets_received counter and directly measure how many packets are received in the server.

The benchmark utility with first argument = 1000000 generates 5 million statsd API calls, that is, 5 million UDP packets.

Of these 5 million packets, nodejs statsd was able to capture 2106768, 1596275, 1479145 and 1490640 packets over several runs.

Net::Statsd::Server, again in 3 different runs, was able to capture 2106242, 1884810, 1822042 and 1866500 packets.

I have performed more tests, and they had a very low deviation from the last runs (1.5M for etsy’s statsd and 1.8M for Net::Statsd::Server). Removing the 2 peak results of ~2.1Mb, it would seem that the Perl statsd is capable of receiving 22% more packets than the original statsd daemon written in javascript.

Of course, this is just my test. I have tried to run the test on different hardware, but I haven’t got significantly different results. If you try yourself, please let me know what numbers you get. I’d be curious to know :-)

SO_RCVBUF

Given the massive amount of UDP packets that were lost in the tests (50%+ in the best runs), I tried to figure out a way to improve this and I stumbled on SO_RCVBUF.

My understanding was that bumping up SO_RCVBUF on the listening UDP socket would dramatically decrease packet loss. However, I hadn’t been able to prove the theory because I hadn’t seen an improvement in the total number of packets received. At least until I read this article on UDP packet loss on stackoverflow.com, that pointed me to the net.core.rmem_max sysctl.

After modifying net.core.rmem_max, setting it to 100M, just to avoid its effect, and using the following code in Net::Statsd::Server:

# Bump up SO_RCVBUF on UDP socket, to buffer up incoming
# UDP packets, to avoid massive packet loss when load is very high.
setsockopt($self->{server}->fh, SOL_SOCKET, SO_RCVBUF, 1*1024*1024)
or die "Couldn't set SO_RCVBUF: $!";

I can see some very interesting effect.

Re-running the node.js statsd, I could see an increased amount of captured packets (1691700, 1675902, ~10% increase).
Running again the Net::Statsd::Server daemon, I recorded 2678507 and 2477246 packets, for an impressive ~40% increase!

As a last effort, I tried varying the SO_RCVBUF size from 1 to 64Mb to see what effect it had on the amount of captured packets (or UDP packet loss if you prefer).

I haven’t run any scientific set of tests, but I can’t see any statistically significant increase for values greater than 4-8Mb, so I haven’t decided where to set the default in Net::Statsd::Server yet. Any chosen value is likely to need specific sysctl tuning anyway, so YMMV.

Why?

Did I really do it for fun? Yes, mainly, but also because:

  • I don’t like adding node.js to our production stack just to run statsd. I have never operated a node.js server, so I don’t want to take this “risk”. The product we’re building is going live soon! :-) And note that this does apply to anything, it’s not about node.js per se :-)
  • to learn how statsd was put together
  • to learn AnyEvent
  • to learn how to build a high performance UDP server
  • Basically, to learn :-)

Code is up on CPAN, as usual: https://metacpan.org/module/Net::Statsd::Server.

If you happen to use it, please give me some feedback!

Displaying realtime memcached traffic on a backend

Sometimes I like to write down posts like this, to remind myself how to do something, sort of a mental note.
Suppose you have a few application servers that use 1+ memcached servers, and you want some way to display the outbound traffic, providing some insights on what are the most used keys, counters, etc…

Here's a quick way to do that, assuming you're using the memcached text protocol:

tcpflow -ce dst port 11211 
    | cut -b53- 
    | grep ^get 
    | pipestat --clear --runtime 60 --field 2 --time 1 --limit 40

What this does is:

  • Use tcpflow to capture all outbound traffic to destination port 11211, default memcached port.
  • Remove the first 53 bytes from each line, to filter out source and destination ip/ports
  • Only display get requests (alternatively, use set, incr, …)
  • Feed the resulting data to pipestat, a simple but great Perl tool that aggregates the data, displaying the most frequent ones. The specific options I used are good if you want to display quick statistics like other tools as top, mytop, or varnishstat.

It goes without saying that these tools are automatically installed on all servers that our Devops team here at Opera manages. I couldn't work without them :)

Report from the Varnish Users Group (VUG5) meeting in Paris – Day 1

Last week I attended the VUG5 meeting (https://www.varnish-cache.org/vug5). The following is my report of the conference Day 1, the "Users" day.

TL;DR

I learned a lot on (for me) gray areas of Varnish like 3.0, VMODs, ESI and various corner cases. My presentation on how we use Varnish at Opera sparked a lot of interest especially in our thumbnail service.

Day 1, VUG5 users day

Day 1 was held at La Défense, a mega business district just outside of Paris. All day was filled with presentations by Varnish Software people and a few other companies. On with the list, and my notes on the side.

Keynote: Varnish in 2020 by Poul Henning Kamp, Varnish Software

Poul runs thttpd, he's not a varnish user, so welcomes feeback from all users. That's why of the VUGs.

Varnish today is "The HTTP delivery engine". And in 2020? Hard to predict. PHK usually predicts things really badly. What we _can_ see is:

  • HTTP/2.0 Last call status just a few weeks ago
  • Google's SPDY support in Varnish? Most likely. Depends on future development and what/how many clients pick it up
  • HTTP over UDP? Lots of interest in this lately

Most likely future work on varnish:

  • Clearer split of transport and semantics
    (could speak HTTP no matter whether over UDP, TCP or SPDY)
  • Generic pluggable protocols (SPDY, f.ex.)
  • Decouple client protocol and backend protocol. Talk SPDY to client, talk HTTP to backend.

SSL in Varnish? Unlikely, just use Pound or nginx or whatever. Pound is simple and robust.

Varnish Book by Kristian Lyngstøl, Varnish Software

Expanding and improving on the existing training course material, Kristian and some contributors created a "Varnish Book", to help people starting up with Varnish. It will be is freely available at https://www.varnish-software.com/static/book/. Now there's only a cute bunny though.

Varnish + Escenic by Richard Zuidhof, Escenic?

Richard explained how he used Varnish to migrate away from the Apache/Squid/Apache sandwich and made it better/faster and his company saved a lot of money in the process.

Interesting points:

50x errors received from the backends are served doing a restart in vcl_fetch() but hitting a "dummy" backend, a sort of static version of a real backend. Something like:


  sub vcl_recv {
     ...
     if (req.restarts > 0) {
         set req.backend = dummy;
     }
  }
 
  sub vcl_fetch {
     if (beresp.status == 500) {
        return (restart); # Or whatever this is
     }
  }

Also talked about various timeouts, like:

 
  {
    .first_byte_timeout = 1s;
    .between_bytes_timeout = 1s;
  }

and how he needed to reset them back to 120s/180s for some of their pages to work.

He said: a timeout event from backend should cause Varnish to fall back to stale content. Not the case currently.
Varnish will abort the fetch operation. So pay attention.

Mobile device detection by Lasse Karsten, Varnish Software

Talked about various libraries and ways to detect mobile devices, including:

  • libvarnish-deviceatlas
  • WURFL
  • … others I didn't write down in time

Basically it was a way to survey how many people
use this technology and say that Varnish Software has a
commercial solution but they are going to open source
it Soon(tm), or something along these lines.

I was a bit distracted because I was having problems with the laptop and my presentation
was coming up, so… I plan to go back to this presentation once the slides are up.

ESI and Varnish by Federico Schwindt, RBS

Summary of how RBS is using ESI for an internal website used by RBS employees.

Basically the service is composed of various "boxes", small windows in the page with some information that depends on location, department or other things, and they use Varnish to cache those small boxes and ESI to compose the final page.

Problems:

  • They can't find a way to also keep the fully composed page as a cache object.
  • Invalidation logic is complex because of inter-dependent content between different boxes.

Interesting: they use a HTTP header sent by the backend to instruct Varnish on when to do ESI processing, so ESI is not a on/off as a whole, but it can be triggered on specific pages. This is very cool because it could also solve the development/production setup problem I had always feared when using ESI. With that I mean the complication of using development environments with ESI, where every dev installation needs a ESI-aware varnish.

Varnish at Opera by me

I talked about how we use Varnish in our projects. I mentioned a few Varnish extensions I worked on, including varnish-accept-language and varnish-geoip, plus other tools like http-cuke.

There were plenty of real world examples of VCL configuration we use in the various projects. I also talked about the varnish puppet module we wrote, that comes with a bunch of interesting customizations and fixes, included in the puppet-modules repository on Github.

If you're interested, slides are published here:

http://www.slideshare.net/cstrep/vug5-varnish-at-opera-software

I got lots of feedback and questions about our picture thumbnail service, so I'll probably write more about it soon.

Security with VCL by Kacper Wysocki, Redpill Linpro

Easily one of the best talks of the day. Kacper explained his security.vcl project. Here's a few highlights, but it's really interesting, I hope slides will be up soon.

  • Wrote modsec rules parser and converter to VCL
  • Eduardo Scarpellini, Master thesis, OWASP, worked on a varnish-firewall project, similar in scope, and did a in-depth research, finding that out of the OWASP top broken apps, he could automatically block 73% of XSS and SQL injections.
  • security.vcl is now used in ~10 sites with lots of traffic
  • Drawback compared to mod-security is that no POST data can be analyzed (yet)
  • In the future, we will see a merge of security.vcl and varnish-firewall projects.

Varnish modules by Kristian Lyngstøl, Varnish Software

I don't remember much, but I think Kristian basically tried to get more people to use VMODs, and said there's now a nice page where a list of known VMODs is kept:

http://www.varnish-cache.org/vmods

and you can register your own VMODs and have them listed.

Stay tuned for the "Day 2, Developers day" part.

Using hypnotoad in production, anyone?

So, you're using hypnotoad in production. And it works perfectly for you. Maybe you have an Nginx or Apache in front of it configured as reverse proxy. Everything's great. Right? Right. Then I have a zillion questions for you.

Maybe I don't understand how it works, but I'm having the following problems:

  • "sometimes" hypnotoad won't stop. I usually try to stop it with:
    hypnotoad --stop /path/to/my/script
  • I use symlinks to deploy applications, so for example I deploy in /opt/myapp and each new deployment gets a timestamped folder, /opt/myapp/releases/20120224-180801.

    Then there's a symlink that always points to the last deployed version, /opt/myapp/current/opt/myapp/releases/{whatever-datetime}. Now, using hypnotoad --stop /opt/myapp/current doesn't work, because hypnotoad probably uses the actual filename, not the symlink, to identify the running application.

    That's fine, but then how can I stop it reliably? I wish it had a hypnotoad --force-stop mode or something.

  • Last problem, when I push a new deployment, and stop and restart hypnotoad, often the application doesn't work properly, it only generates exceptions for unknown reasons. Stopping and restarting again manually usually fixes the problems…
  • I was a bit frustrated today, so I decided to switch back to starman. I have never ever had a problem with it, so I will stick to it for now. But I would still be interested to know whether you use hypnotoad in production and how well it works. Write in the small box below, you don't need to register. Thanks :)

My experience at Velocity Europe 2011 in Berlin

TL;DR

This year there was the 1st edition of Velocity Europe. I got to present a talk on a DDoS attack we faced at Opera, and it was really awesome to be there.

The long version…

Around July this year I knew there was going to be a Velocity Conference in Europe, and I decided I would try to propose a few ideas for talks. I didn't have my hopes too high, but I wanted to give it a shot anyways, pushing myself way out of my comfort zone :)

The worst that could happen was that the talks didn't get accepted. After a month or so the crazy thing happened, and I got an invite to speak at Velocity, due in November.

Preparation

The first few months passed while I was slowly gathering material for the talk. The idea was talking about the DDoS attack that struck us in October 2010. Almost a year had passed, so if we hadn't taken notes and collected all sorts of logs and information, we wouldn't have had any chance to reconstruct all the "story" with enough detail to be interesting.

Anyway, weeks went by, and in September I started writing down an outline of the talk. It consisted in describing what happened during the DDoS and how we faced it, what we did, how we figured out what to do, etc… but I didn't have a clear idea of what to convey with the actual presentation. What would be the core message, if any?

If I learned anything out of all this, is that writing an outline is absolutely the best favor you can do to yourself to avoid so many problems later on. Just write it down as a text, a blog post, a story. Mind maps are also useful for me.

Last 3-4 weeks flew away while I was trying to put together a decent deck of slides.

In Berlin: pre-conference

"Birds of feathers" was the pre-conference event that took place on Monday 7th (November 2011, if you're reading this in the future), put together by a local team led by Schlomo Schapiro, which I got to talk to also during the conference. It was a good event, Steve Souders and John Allspaw and many other conference attendees were already there. There were sponsor companies presenting their products.

The most interesting sessions of the pre-conference IMO were:

  • 100ms: Steve Souders pushed everyone to think about the next level of web performance. How to bring down the "loading time" of web pages to 100ms. There was an interesting discussion about that. My point was that loading time really needs to be divided into at least dns resolution, server processing, network transfers, client rendering. So there's at least 4 totally different chunks that make up the load time and all of them can be optimized, but with varying levels of gain and complexity.
  • Dyn inc presentation about their product dashboard, that led to a better productivity and communication between teams. Cory van Wollerstein explained their mash-up of Jira and Confluence, used to automatically pull information from the tickets db and provide high-level overviews to executive teams. Very cool. He also argued whether having product managers is a good thing for a company.

The rest of the day I was busy polishing my presentation, and trying to rehearse at the hotel. A month before the conference, I had bought The Naked Presenter (ebook edition), hoping that it would help me do a decent presentation. The book of course recommended to rehearse. It felt very weird and embarassing, but I'm *so* glad I did it. I managed to streamline the presentation, and memorize the sequence of slides.

The Conference – Day 1

Schedule:

http://velocityconf.com/velocityeu/public/schedule/grid/2011-11-08

Keynotes

Opening remarks, plus Theo Schlossnagle, one of the minds behind SurgeCon, on how good operations dudes are usually generalists and need to have a wide spectrum knowledge instead of being "(Perl|Python|Ruby|Java) developers". I really recognize myself in this more generalist role than, for example, the Ruby-on-Rails guy.

Lightning demos

These were lightning demos during the first morning:

Rest of Day 1 went to hell

I had to convert all my slides to 4:3 and test again with the on-site equipment. I was also freaking out at the same time, so I missed everything else until my talk. Sorry :)

Most talks have been recorded and are already up on the Velocity site. Particularly interesting IMO, but video not available yet, are:

My talk

As I said, it was about the DDoS attack to my.opera.com of October 2010. I basically talked about how we found out we were under DDoS, and how we struggled to find our way to keep the site up and running despite the traffic. This was a mid-scale DDoS with around 18k distinct IPs attacking us. We had a hard time, but it was also very much fun in retrospect :) We learned quite a lot in the process, about HTTP and TCP/IP, nkiller2 and the TCP zero-window exploit. Most importantly, we learned to make better use of old and new tools to do troubleshooting. You will find all of this in the slides.

I did my best, and I think it was well received by the audience. While on stage, I really had the feeling that people enjoyed it, plus several folks came to say hello afterwards. One of the most frequent comments I heard was that people found my talk honest. That is the single thing I appreciate the most, because that had been one of my goals since the start. To tell an honest and detailed story of how things went, without pretending to be the super awesome heroes that know everything and can fix anything in no time.

Unfortunately, after the conference I was informed that there had been no recording of the talk. That is really sad. However, since there's no recording, I can pretend I was a nice speaker, given the ratings :). Seriously, if you have a picture or video recording, contact me :)

Here's the slides if you're interested:

http://velocityconf.com/velocityeu/public/schedule/detail/21653

The Conference – Day 2

Schedule:

http://velocityconf.com/velocityeu/public/schedule/grid/2011-11-09

Keynotes

Very inspirational talk by Jeff Veen, Typekit.com

Very well presented, great visuals. Great overall. How to create conditions for teams to work and work well.

http://velocityconf.com/velocityeu/public/schedule/detail/21788

Anticipation: What could possibly go wrong? by John Allspaw, Etsy

A great talk about how to prevent, analyze, respond to Operations problems. I very much like John's style, I think he's a pioneer, at least he introduced me to many great ideas, one above all, continuous deployment. I also like his many references to aviation, aerospace and military engineering fields.

http://velocityconf.com/velocityeu/public/schedule/detail/22258

Full stack awareness, Artur Bergman, Fastly

He's Artur Bergman. Listen to him :-) If anything, because he's really authentic.

http://velocityconf.com/velocityeu/public/schedule/detail/22914

Lightning demos

Another session of lightning demos, for our pleasure:

Browser performance track

This was a track in itself. I lost all of it, since I mainly followed the Operations track, but this was really interesting I heard. Recent speed enhancements in Opera, Chrome, Firefox and Javascript in general were explained in detail.

Afternoon talks

Deploying large payloads at scale, Ramon van Alteren (hyves.nl)

Biggest social network in the Netherlands (4M daily active users, ~10M total users). Ramon is a very cool guy. They have 3.5K servers, and their main application consists of 750Mb compiled php binaries to deploy. And they are experimenting with bittorrent tools to do that :)

I had a few hours of engaging talk with Ramon at one of the social events that followed the conference. We found lots of similarities in how we're dealing with infrastructural growth, scaling, etc… We both use config management tools like puppet extensively in our organizations. We promised each other to remain in touch about deployment matters.

http://velocityconf.com/velocityeu/public/schedule/detail/21571

HTTP connection management from 10 users to 100 millions, Bradley Heilbrun, YouTube

Really interesting dive into YouTube early (2005-2007) architecture with Apache, load balancers, GSLB.

I met Bradley later on that day and we had a quick chat. Turns out they use(d) PowerDNS with its pipe backend for geographic load balancing, much like as we do in Opera with GeoDNS. That made my day :-) It's a pity that companies like YouTube don't talk much about their current technology. They usually tell you about 2-3 years old architectures. That's still very valuable, of course.

http://velocityconf.com/velocityeu/public/schedule/detail/21708

Conclusions

If you're even remotely interested in operations, devops, running a service, scaling, performance, infrastructure, then Velocity is the conference. Surge is another one, probably even better, more hardcore-engineering focused. From my perspective, there's a couple of things that could be improved:

  • while I understand that sponsors are what makes conferences like Velocity possible, some sponsors took too much time out of the actual talk tracks. One or two talks were very promotional in nature, and it was clear to everyone that these companies were pushing their products or themselves. Maybe it wasn't their intention, but to me and to others I talked to, it came out that way.
    I think Velocity needs to screen better this type of talks and separate them from the authentic content that people want, the "stories from the trenches". As a counter-example, Google, among other companies, were doing sponsoring (and recruiting!) activities in a separate hall. That worked very well for everyone. Please let's keep it that way.
  • the on-site technical team wasn't fully prepared to handle presentations made with Open Office. That is not acceptable if you ask me, even if the majority of speakers have a Mac. It's 2011 (2012 now even), so you really need to be prepared to read OpenOffice files. I realize that wasn't Velocity organizers' fault, but I think it's something to consider for next time.

That said, I'm really really happy about my experience at Velocity Europe, both as a speaker and as attendee. It was really awesome, and worth every moment I spent working to prepare for it. Thank you O'Reilly, and I hope to be able to participate again some day :)

Surge 2010 scalability conference in Baltimore, USA – DAY 2

This is a summary of day 2 of the Surge conference that took place in Baltimore, USA, 30th of September and 1st of October 2010. For a quite comprehensive blog post about day 1, you can read my previous post.

Here comes the list of talks I attended during Day 2.

Brian Cantryll – failures in commodity hardware

What happens when commodity hardware is used in an "enterprise" hardware project? Brian guided the audience through this industrial hw project. There was no recorded video of this talk, due to the content being potentially "sensitive". Very interesting talk, and Brian is IMO a very good speaker.

Benjamin Black – FastIP

Benjamin presented a – for me – new way to analyze metrics of a network, named "Flow". The flow-based network metrics can represent a network activity in a way that is completely different and much more accurate than what's usually done by operations and sysadmin departments. The downside is that is generates a lot of data. The advantage is that you can analyze and even replay? any traffic that took place between any two nodes of the network. I'm sure I didn't understand correctly because this would be amazing.

There's products out there that offer flow-based network analysis: Cisco Netflow, Ntop NProbe, etc… There's also a IETF working group about flow. We couldn't see any example/demo because there was a problem with the slides, IIRC.

FastIP also offers a related service. I contacted Benjamin about this after his talk. Maybe we'll be able to try something out or at least have a demonstration.

My TODO list:

Gavin Roy – Scaling MyYearBook.com

One of the most interesting talks in this conference IMO. MyYearbook is a Postgres shop, among the top 25 trafficked sites in the USA.

Gavin talked about many things they did to scale their site as the traffic was growing. Here's some of the things I remember:

  • DB connection pooling very important for them. Made a world of difference. They use PgBouncer and pgPool2
  • DB Horizontal scaling with pIProxy. TODO: look it up
  • DB Replication w/ Londiste, Slony, Bucardo
  • Postgresql 9.0 based standby to increase read-only capacity, and for hot-standby.
  • Partitioned the database by table, feature available since Pg 8.1

They have a primary-to-secondary master failover procedure. They looked into automating it, but a tech judgement is really necessary in case something goes wrong, so they will keep it manual. This was a question I asked to Gavin, since we've thought about automating our failover procedure for MySQL, but it's not so easy to just decide when to trigger the failover…

For user storage, they use Isilon IQ Series, apparently a FreeBSD appliance with on-board NFS. For DB servers, they looked at different solutions, but they keep coming back to direct attached storage. Their man db server, they have a massively powerful machine, IIRC, 512Gb of RAM and 128 cores machine. I have to double check this because it seems really impressive.

John Allspaw – Go or No Go

Another great talk by John, well presented and with great content. Not easy to summarize. The main topic was the "Go or no-go meeting", a 10 minutes get together of all involved parties before releasing changes or launching any new feature live.

This meeting basically consists of Yes/No questions:

  • Have you tested enough to deploy? QA still needed?
  • Has the feature being communicated (blog/forum/…)?
  • Does everyone know: when it will go live? who will push the feature?
  • Has the feature been in production for staff (or beta users)? That can be tricky to implement if the new feature implies social interactions (beta user tagging non-beta user)
  • Is it possible to dark launch this feature? Will we?
  • Is it possible to turn on this feature on a % of users? Will we?
  • Does it involve new infrastructure? If so: is there monitoring in place? (BLOCKER)
  • On/Off switch in the code/config is in place? Is it documented?
  • Are all the relevant people available for communication and launch?
  • Is there a place for users to provide feedback about the feature?
  • Post-launch "it's all done" time agreed?
  • Contingency checklist done and everytime reviewed it? (BLOCKER)

The "Contingency list" should answer the question: "What could possibly go wrong? What will we do about it?", with a list of potential issues and how to solve them in case shit hits the fan.

Apart from the Go/No-go meeting, which would be, also according to my past experience, a great way to avoid problems, there's at least a couple more really nice things to keep in mind when developing or launching a new feature:

  • "Dark launches": a dark launch is essentially a full launch of the new feature, but in such a way that is invisible to users. So if you're making db queries and processing stuff, you keep doing all that, you just throw the data away. You will be able to realize the (almost) full impact of the new feature on your application and compensate accordingly.
  • Feature "sampling" (% of users): you just enable the full feature for a small, and then growing, percentage of your user base. You can gradually grow to 100% and test the effect of the changes.

Great stuff.

Neil Gunther – Quantifying scalability

Here I was a bit too excited, due to my talk coming next, so unfortunately I didn't pay too much attention. It's a full analysis of scalability seen as a mathematical function, as capacity of your system as the load increases.

Cosimo Streppone – Scaling challenges of my.opera.com

I think

I used 5 minutes to show a live demo of the My Opera realtime monitor application that we built and afterwards I got very interesting questions, and also some nice twitter messages about it.

I also talked about how we've experimented in distributing requests across the different datacenters with our little geodns tool.

All in all, for me it was a fantastic experience. Practice will make me better, so I look forward to a next time :-)

Baron Schwartz – Scaling without sharding

Baron works for Percona. I had read some talks of his. I think he's a really good speaker. He explained in detail the scenarios that arise when dealing with database scaling, the typical characteristics of reads and writes, single server vs multiple servers deployments.

Basically what the talk tries to suggest is that very few situations require to shard your database. Single server setups can go very far, by optimizing the way the db works. Quote: "Sharding should be your last resort". Sharding should be enforced when write demand exceeds write capacity, so avoid sharding if you can, try to buffer/collate writes, defer update work, etc..

Closing day 2

Theo Schlossnagle closed the conference with a plenary keynote about a semi-serious "brief history of computing". Much fun, and a goodbye to next year's Surge.

For a glimpse of what happened live at the conference, you can also check out the Twitter stream for #surgecon.

Definitely a great conference. Stay tuned for videos and slides on the official site, http://omniti.com/surge/2010.