During the last few days I looked into JVM memory monitoring tools.
That is one area of expertise that I am definitely not familiar with. The general approach in my career so far has been to avoid Java for long running processes :-) The only other (empirical) pearl of wisdom I remember from past experiences with Java™ is that the max heap memory should be less or equal to the max system memory divided by 2 (maxHeap <= totalMem / 2). I’ve seen this relation work nicely over the years for a fairly busy Solr search cluster with anywhere from 24 to 96Gb memory servers, where maxHeap was never higher than 8Gb though, as those servers had a lot of other processes running at the same time. Obviously if other processes are running concurrently on the system, the max heap size should be decreased accordingly.
When observing servers, it’s typical to monitor the “usable†memory (in Datadog, that would be system.mem.usable) which is a sum of the system current free and cached or buffered memory. That is, the total memory that the system can grab and use at any time if needed.
This measure doesn’t necessarily tell us which processes are using memory and why. We’ve also observed spikes of memory usage when log aggregation tools like filebeat are reading, parsing and shipping logs to the logging servers. It would be useful to start tracking how much memory is used by the specific merlin java process rather than looking at an aggregated memory metric.
Searching around, I found a few useful articles (among them https://www.pushtechnology.com/support/kb/understanding-the-java-virtual-machine-heap-for-high-performance-applications/) and several tools that helped dig deeper and extract more information about what is happening on the gameservers with regards to memory usage. I’d like to mention them here for future reference and to collect eventual feedback from others.
jvmtop
​URL: github.com/patric-r/jvmtop
Simple console application that provides high level stats about heap usage and garbage collection CPU usage. Here’s an example from the documentation page:
JvmTop 0.8.0 alpha   amd64  8 cpus, Linux 2.6.32-27, load avg 0.12
 https://github.com/patric-r/jvmtop

  PID MAIN-CLASS      HPCUR HPMAX NHCUR NHMAX    CPU     GC    VM USERNAME   #T DL
 3370 rapperSimpleApp  165m  455m  109m  176m  0.12%  0.00% S6U37 web        21
11272 ver.resin.Resin [ERROR: Could not attach to VM]
27338 WatchdogManager   11m   28m   23m  130m  0.00%  0.00% S6U37 web        31
19187 m.jvmtop.JvmTop   20m 3544m   13m  130m  0.93%  0.47% S6U37 web        20
16733 artup.Bootstrap  159m  455m  166m  304m  0.12%  0.00% S6U37 web        46
where the various columns are:
PID = process id
MAIN-CLASS = the "jvm name" but often the entry point class (with used main() method)
HPCUR = currently used heap memory
HPMAX = maximum heap memory the jvm can allocate
NHCUR = currently used non-heap memory (e.g. PermGen)
NHMAX = maximum non-heap memory the jvm can allocate
CPU = CPU utilization
GC = percentage of time spent in garbage collection (~100% means that the process does garbage collection only)
VM = Shows JVM vendor, java version and release number (S6U37 = Sun JVM 6, Update 37)
USERNAME = Username which owns this jvm process
#T = Number of jvm threads
DL = If !D is shown if the jvm detected a thread deadlock
Useful to get a quick glance at a few critical parameters. I have tested the most recent version (0.9.0) and the compilation from the source code was quick and easy.
jvm-mon
​URL: github.com/ajermakovics/jvm-mon
Another console application, but a bit more sophisticated than jvmtop. It also displays trends as it’s meant to be run for a longer period of time. I think this is the appropriate level of fancy I like :-)
 I quite like jvm-mon, it’s clear and the data is easy to understand. The charts resize dynamically based on how long you keep it running.
jps_stat
URL: github.com/amarjeetanandsingh/jps_stat
A simpler shell script that displays more or less the same information shown by jvmtop and also keeps running and updating the stats. AFAIK, it’s not possible to run it “one-shotâ€. That would be useful to build our own metric monitoring.
This is what jps_stat looks like when executed: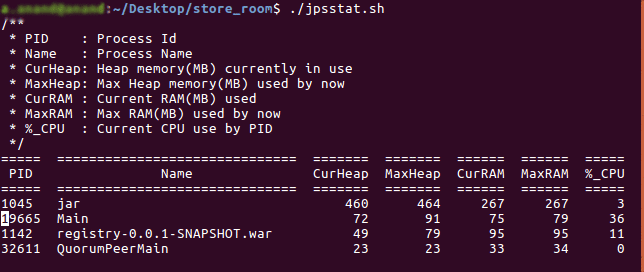
jstat
https://docs.oracle.com/javase/7/docs/technotes/tools/share/jstat.html
Last of the lot is jstat which is part of the JVM distribution. Usage is very simple and it can easily be embedded in a one-liner or a shell script, as in:
watch -d -n1 jstat -gc $(pidof java)`jstat -gc` outputs garbage collection statistics, some of which I still haven’t understood the purpose. A sample output is the following:
Every 1.0s: jstat -gc 12743                                                                                                                                                                Thu Jun  6 09:33:23 2019

 S0C    S1C    S0U    S1U      EC       EU        OC         OU       MC     MU    CCSC   CCSU   YGC     YGCT    FGC    FGCT     GCT
34048.0 34048.0 10229.3  0.0   272640.0 37062.4  2731264.0  1519963.6  32192.0 30728.8 3804.0 3510.3  34926  873.839  26      2.781  876.620
These metrics are a bit more detailed than just looking at heap usage as a whole. I’m not really sure I need to look into all of this specifically.
Conclusion
Not much to say, but for now it was useful to get a bit more details of how the server is running, how much heap memory is consumed, how much non-heap memory is used, and how the total memory used by the java process itself compares to the total memory used on the server.
Plus, it’s handy to write down these things so I can refer back to them when needed :-)
Pingback: Long-lived JVM applications memory usage tuning | Random hacking