These will be personal comments on the text that AWS put out after the October 19th 2025 us-east-1 outage, which you can find here: https://aws.amazon.com/message/101925/ and a bit more readable version here.
Important premises before starting:
- While I’ve been working on web operations for a long time, I have never dealt with services as big as AWS, and also I don’t know anything about how they operate internally.
- I have the utmost respect for AWS SREs and engineers that had to deal with this outage, so this is in no way intended to downplay the quality of the services or the recovery work done there. On the contrary…
Let’s start.
At Kahoot!, the first signal that something was wrong was Slack being slow or unresponsive in our, Central Europe, morning. We didn’t know that AWS or the us-east-1 region was involved in any of it. As we realized Slack was not operating correctly, a few of us sent test messages in our backup channel on a Google Chat room “? SRE Team”, used a handful of times over a few years. It can be cumbersome to establish a backup channel when Slack is suddenly down.
Takeaway 1: establish and document your backup comms channel if and when the primary fails.
In my case, I had another problem. My Firefox install had started acting up, in the special way Firefox fails when you have used snap to install it. I will spare you my thoughts on snap itself, none of which are positive. After 15 minutes of head scratching, I realized the issue might be with Firefox and not related to the AWS outage, and restarted my browser.
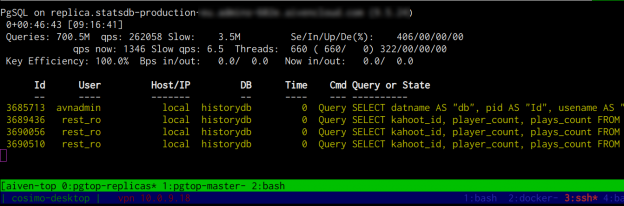
The impact on our infrastructure has been minimal. We’ve seen a few AWS API calls fail, but essentially nothing else. Our EC2 instances and AutoScalingGroups in us-east-1 have been up and running with no issues.
It’s always DNS! Except when it isn’t…
Many cited the “It’s always DNS!” meme. My guess is that they probably haven’t read the AWS text. This was not a DNS failure. It was the system AWS designed to update those “hundreds of thousands” of DynamoDB DNS records, that failed due to a race condition. More on that below.
Is that a sign that few people take the time to read things through?
Outage text commentary follows
If you haven’t, I’d suggest reading Lorin Hochstein’s blog about the outage. I won’t be mentioning any of Lorin’s points here.
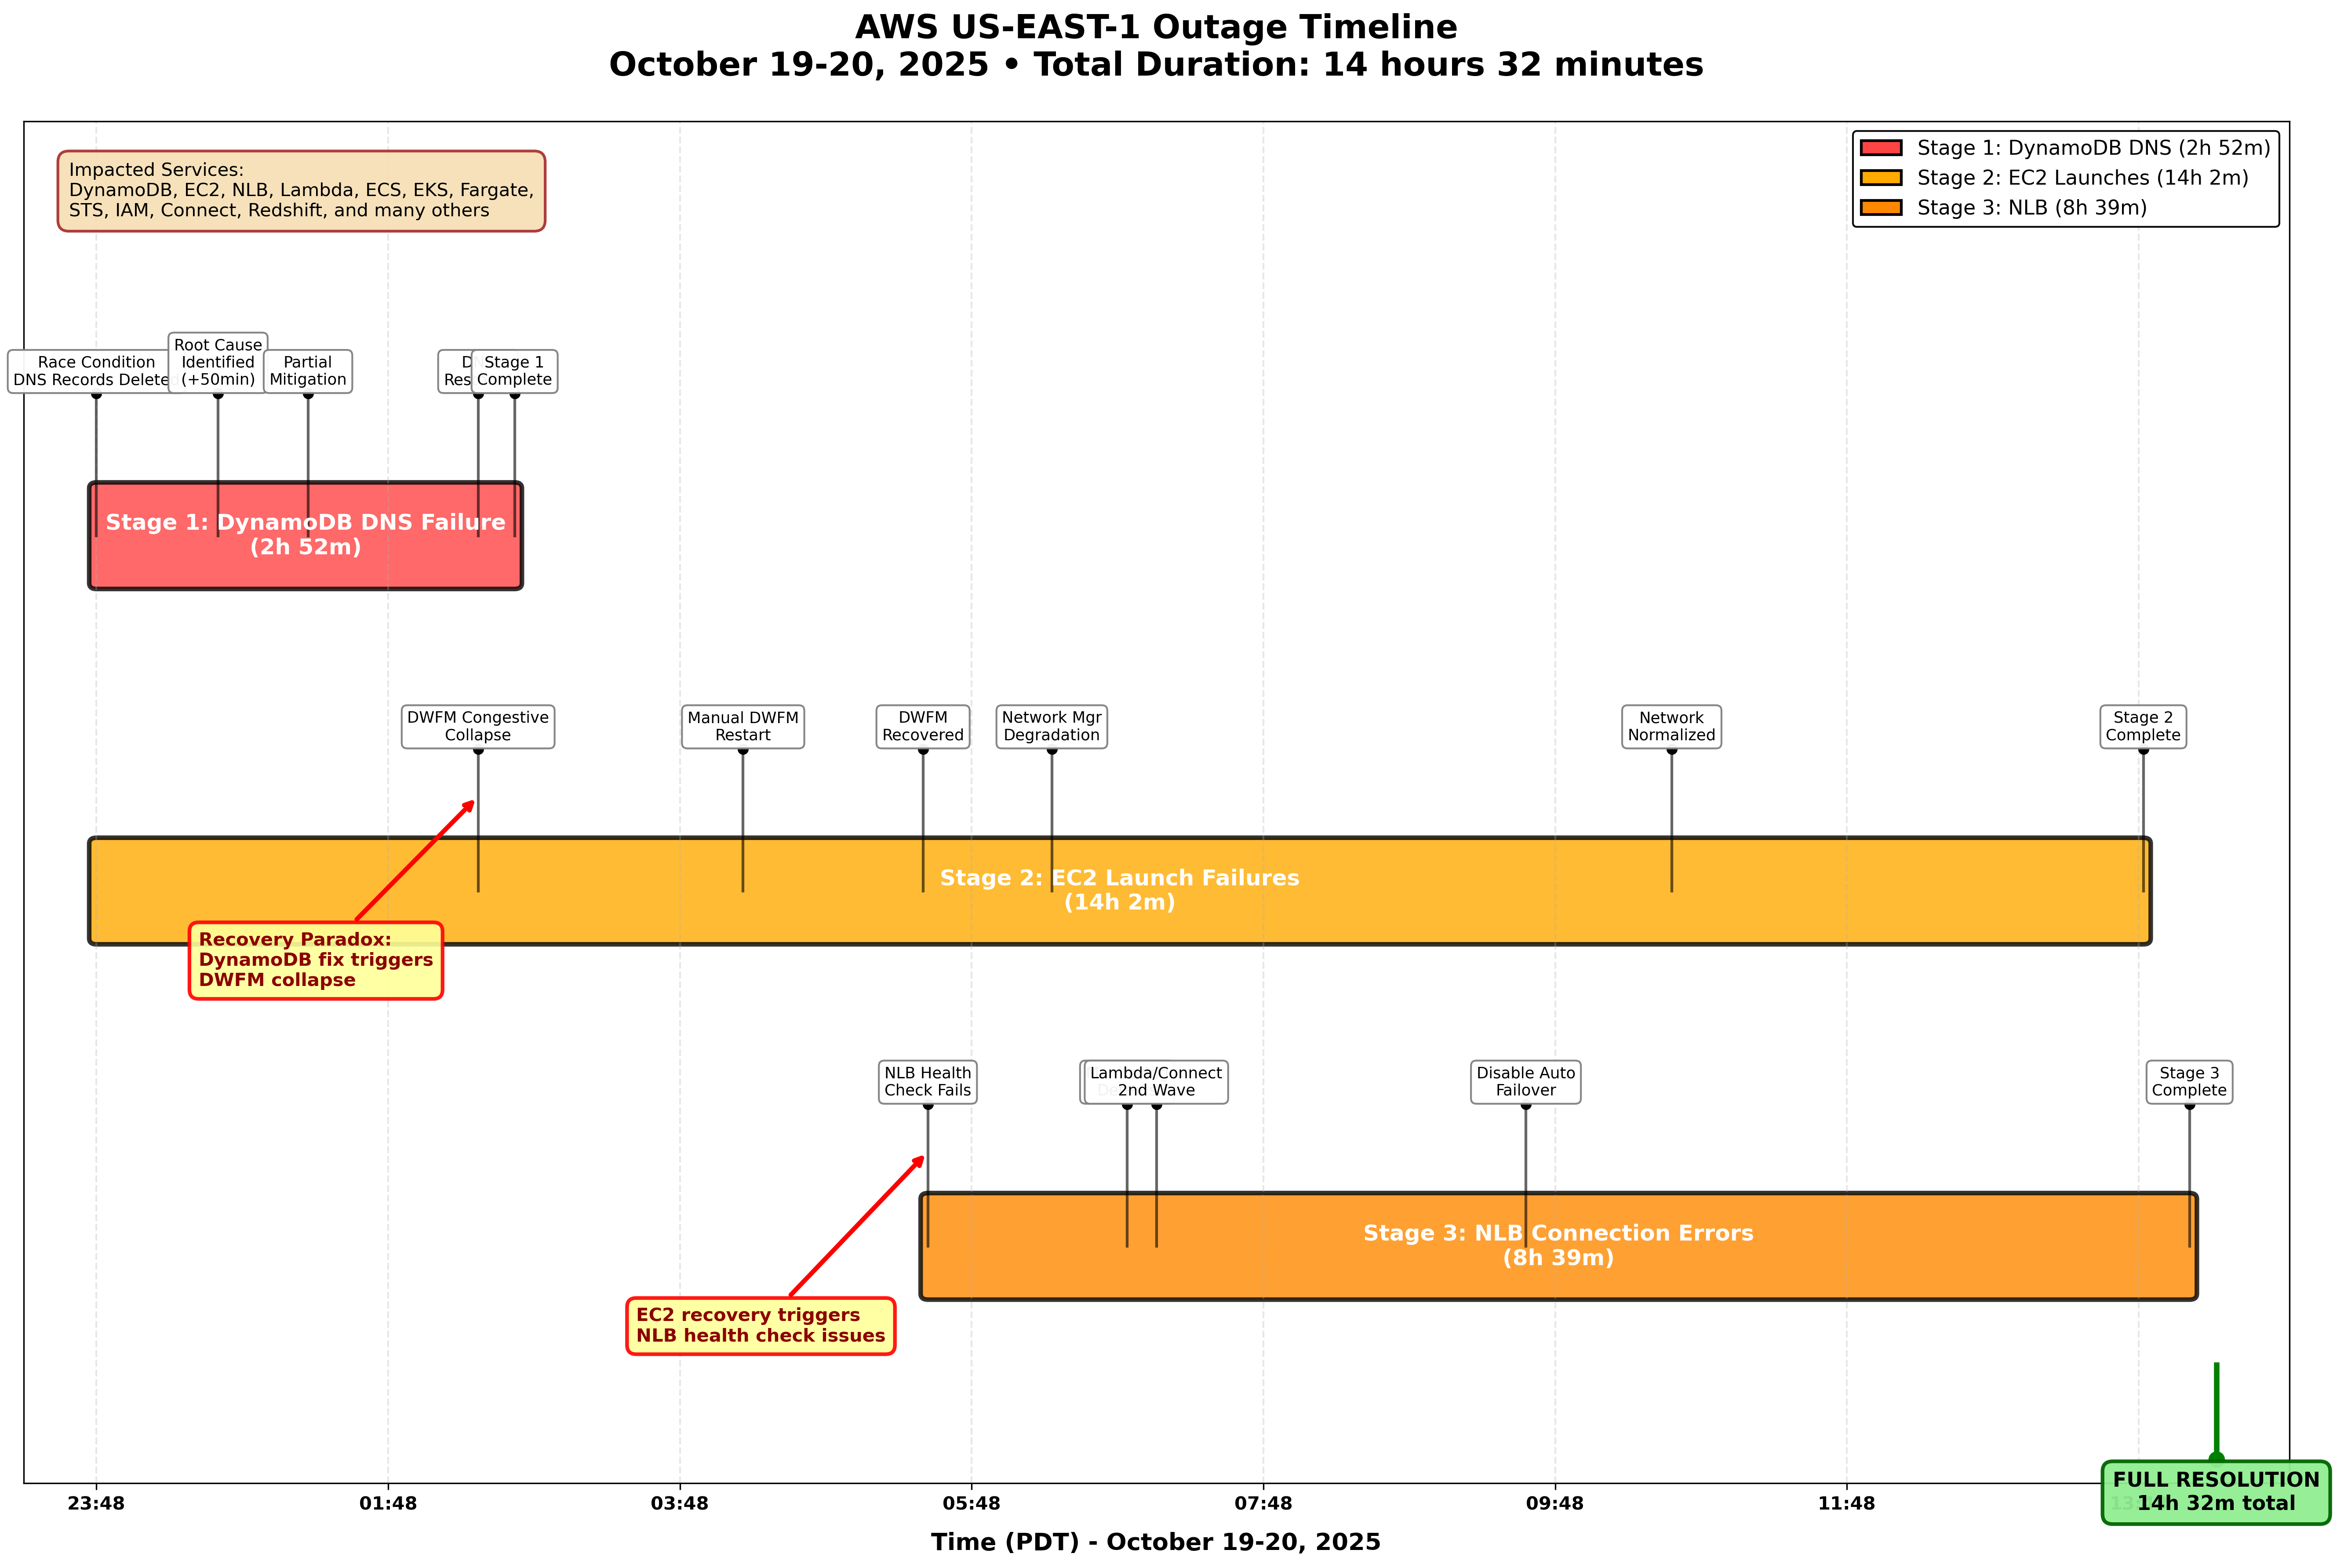
Engineering teams for impacted AWS services were immediately engaged and began to investigate. By 12:38 AM on October 20, our engineers had identified DynamoDB’s DNS state as the source of the outage.
11:48 PM to 12:38 AM means 50 minutes from when the issue started to detection. That seems … quite a lot of time. I don’t know the details, of course. My guess is that DynamoDB is so core to most AWS services and so reliable that it’s hard to imagine it could have issues. This is also confirmed by the fact that “key internal tooling” depends on DynamoDB, meaning it must be very rare that it’d be down or unavailable.
Makes me think of those times when some component, script or cronjob that had been reliably working for years, seems to be the one failing. You’re thinking: “No way, it can’t be THAT! It’s been working perfectly fine for at least 5 years!”. And yet, something this time has changed that caused the failure. Such cases happen. I’ve been smacked in the face a few times :-)
By 2:25 AM, all DNS information was restored, and all global tables replicas were fully caught up by 2:32 AM. Customers were able to resolve the DynamoDB endpoint and establish successful connections as cached DNS records expired between 2:25 AM and 2:40 AM.
We can conclude that no DNS records for us-east-1 DynamoDB endpoints were available between 11:48 PM and (partially) 2:40 AM. The DynamoDB endpoint hostname for the us-east-1 region is dynamodb.us-east-1.amazonaws.com. Negative DNS lookups, which I take to be NXDOMAIN responses in this case, are to be cached by resolvers. This can be a problematic if the TTL for such negative responses is high. In case of the DynamoDB regional DNS zone, this is currently set to 5 (five) seconds.
To understand this, let’s look at the SOA record for the us-east-1 DNS zone, which controls how long DNS responses are cached for:
$ dig soa us-east-1.amazonaws.com +multiline +noall +answer
us-east-1.amazonaws.com. 895 IN SOA dns-external-master.amazon.com. root.amazon.com. (
                                22366      ; serial
                                180        ; refresh (3 minutes)
                                60         ; retry (1 minute)
                                2592000    ; expire (4 weeks 2 days)
                                5          ; minimum (5 seconds)
                                )
The last number in the SOA record is the minimum TTL, used as TTL for negative responses. Hence any lookup for dynamodb.us-east-1.amazonaws.com that returned an NXDOMAIN response (record not existing) would be cached for just 5 seconds. I’m wondering whether AWS have changed this value after the outage, as otherwise the time for clients to recover during the incident would have been much shorter. Wondering what sort of loads this imposes on their DNS serving infrastructure…
Takeaway 2: if you have particularly critical services, verify that the negative DNS response TTL you advertise in your SOA records is appropriately set, so that clients can recover quickly when DNS records are restored. Five seconds might be a bit extreme for anyone except huge companies, also because it can impose a tremendous load on the DNS infrastructure. Something like 60s might be more appropriate for mere mortals. YMMV.
EC2
DynamoDB being the backbone of many internal AWS services meant that EC2 was also impacted. I won’t reiterate here how or why. Instead:
Existing EC2 instances that had been launched prior to the start of the event remained healthy and did not experience any impact for the duration of the event.
That’s what we saw. Our existing EC2 instances in us-east-1 kept running with no issues. We were also “lucky” that our AutoScalingGroups didn’t initiate any scale-in or scale-out events, being night time in us-east-1. Those would have probably failed, at least the scale-out ones, as launching new instances was one of the impacted operations.
Other more “complex” services were impacted. Our AWS usage is relatively basic, we don’t use esoteric services or configurations, so we weren’t affected by the EC2 issues during the outage. Keeping things simple has been advantageous in this case.
Takeaway 3: Simple, “boring” infrastructure choices can be surprisingly resilient. Complex service configurations and dependencies increase your surface area for cascading failures.
DropletWorkflow Manager
Each DWFM manages a set of droplets within each Availability Zone and maintains a lease for each droplet currently under management. This lease allows DWFM to track the droplet state, ensuring that all actions from the EC2 API or within the EC2 instance itself, such as shutdown or reboot operations originating from the EC2 instance operating system, result in the correct state changes within the broader EC2 systems.
As part of maintaining this lease, each DWFM host has to check in and complete a state check with each droplet that it manages every few minutes.
Starting at 11:48 PM PDT on October 19, these DWFM state checks began to fail as the process depends on DynamoDB and was unable to complete.
While this did not affect any running EC2 instance, it did result in the droplet needing to establish a new lease with a DWFM before further instance state changes could happen for the EC2 instances it is hosting.
Between 11:48 PM on October 19 and 2:24 AM on October 20, leases between DWFM and droplets within the EC2 fleet slowly started to time out.
At 2:25 AM PDT, with the recovery of the DynamoDB APIs, DWFM began to re-establish leases with droplets across the EC2 fleet. Since any droplet without an active lease is not considered a candidate for new EC2 launches, the EC2 APIs were returning “insufficient capacity errors” for new incoming EC2 launch requests.
This description of the inner workings of the DropletWorkflow Manager is quite fascinating. From my point of view, DWFM was designed really well to effectively fail in such a graceful way. Being defensive is a useful trait in systems design. This is an excellent example of “failing open” design philosophy. The system degraded gracefully rather than causing widespread instance failures.
After attempting multiple mitigation steps, at 4:14 AM engineers throttled incoming work and began selective restarts of DWFM hosts to recover from this situation. Restarting the DWFM hosts cleared out the DWFM queues, reduced processing times, and allowed droplet leases to be established.
The oldest trick in the book! A well-placed server restart can help :-) I did this regularly years ago, then started to prefer trying to understand the actual failure at hand, before kicking the server and thus sometimes preventing further observations to understand the cause of the fault. Sometimes it’s still a viable way to get out of trouble, even in AWS apparently.
Network Load Balancers
NLBs being based on EC2 instances, they were impacted by the outage.
Our monitoring systems detected this at 6:52 AM, and engineers began working to remediate the issue.
That means 80 minutes from the first NLB issues to detection at the monitoring layer. That’s an indication that the recovery work was either quite challenging, or just that it took that long to notice. It would be again very interesting to know what exactly happened during that time.
Other AWS Services
By 2:24 AM, service operations recovered except for SQS queue processing, which remained impacted because an internal subsystem responsible for polling SQS queues failed and did not recover automatically. We restored this subsystem at 4:40 AM and processed all message backlogs by 6:00 AM.
One aspect I haven’t seen mentioned anywhere else is the fact that with all these different subsystems, we can assume many SREs must have been on deck to deal with this outage. Given that, the coordination work will have been absolutely massive and critical as well. No doubt it would have been extremely fascinating to observe how this coordination went on, and how the different teams communicated and collaborated to get things back up and running. Maybe it was a single team of three-five people instead? It was night time in US, so who knows.
Inbound callers experienced busy tones, error messages, or failed connections. Both agent-initiated and API-initiated outbound calls failed. Answered calls experienced prompt playback failures, routing failures to agents, or dead-air audio.
It was the first time I read the term “dead-air audio”. A detour to Wikipedia was definitely worth it.
Customers with IAM Identity Center configured in N. Virginia (us-east-1) Region were also unable to sign in using Identity Center.
Fortunately, our IAM Identity Center is in a different region, so we weren’t impacted there either. I certainly don’t envy teams who were shut off from access to the AWS console. Our observability systems also weren’t affected, but I can see how losing console access and perhaps also losing your observability platform could be a completely paralyzing situation.
Takeaway 4: Spend some time pondering how not only your own systems, but also the 3rd party systems you depend on would react to an AWS outage. Would they make you unable to react? Can you do something about it?
In Conclusion
Finally, as we continue to work through the details of this event across all AWS services, we will look for additional ways to avoid impact from a similar event in the future, and how to further reduce time to recovery.
The AWS message clearly wasn’t meant to be a post-mortem. With that said, there are zero mentions of a human element anywhere in the outage. Perhaps because the DNS automation was … automation, and no manual intervention caused the issues. I would have appreciated learning more about the human factors involved in any case. For example, what challenges the teams faced in identifying that DynamoDB DNS records were missing? Perhaps this is more material for an AWS-internal post-mortem, that people might still be working on.
Multiple DNS Enactor instances applying potentially outdated plans simultaneously seems (in hindsight, clearly) quite risky? It’s always easy to criticize after the fact, but since we’re missing such a huge amount of context and background, the only thing we can do is speculate and also learn from this, as much as we can. If you have, or know where to get more insights into AWS internals, reach out and let me know!