Tag Archives: operations

pgtop – a top clone for PostgreSQL

According to meta::cpan records, the first release of pgtop is dated April 26, 2005, which makes this little software more than 15 years old!

Back then I had just found out about the brilliant mytop by Jeremy Zawodny, and my day-to-day experience being on Postgres, IIRC version 6.5.3, I decided to try and “convert” mytop to Postgres.

Being quite naive, I thought the endeavour would be much easier than it really was. I’m glad I started though, which is why pgtop exists in the first place. It’s not the only one either. I seem to remember a few similar pgtop projects by other programmers.

After using MySQL and Percona Server for many years, due to a new job, I have gone back to Postgres, version 9.5 and 10 at this time. In recent months, I have done some work to improve performance of our database queries, and remembered writing and using pgtop years before.

Since I lost(*) the original sources, I tried the pgtop version I last uploaded to CPAN, 0.05, dated 2008. It did work, in the sense that I could run the same perl code unmodified, a great testament to Perl as language and as runtime. It didn’t work because the underlying Postgres meta tables that were used in version 6 changed their schema in the 10-12 years since :-)

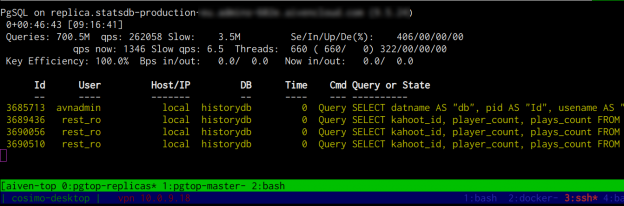
I spent some time to adapt the metadata queries to work with recent Postgres versions, and was slightly amused by the quality of my 15 year old code… The best feeling about this little tool was to rediscover how useful a few dozen lines of code can be. The service provider monitoring helps, but doesn’t even come close to the level of detail pgtop can provide.

After getting pgtop to work again, I quickly added a few more useful features. I was pleased by the efficiency with which I could work on this tool, considering its age.

So far I added just what was strictly necessary to me:

  • Updated pgtop to the current decade. Now requires perl >= 5.014
  • Fixed to work with Postgres >= 9.0
  • Added a sample Dockerfile to build and run pgtop as Docker container
  • Added a --config option, to load arbitrary config files. This is useful if you want to monitor several databases at once, for example in a tmux session. The config file supports all the options that are available on the command line.
  • Implemented a query killer command, activated pressing K to kill at once all queries slower than a given threshold, in seconds. This is useful if the database is overwhelmed by a lot of slow queries. I don’t recommend using it, particularly if it involves killing UPDATE or INSERT queries, but it can be quite useful.
  • Added a --slow_threshold option, to consider queries slow if they have been running for longer than the given value (in seconds). Now the tool highlights slow queries in bold yellow, and logs all the slow queries to a pgtop.log file.
  • Added a --slack_webhook option, to automatically notify a slack channel if a query crosses the slow threshold runtime value. All the information about the slow query including the SQL will be included in the slack message.

Please let me know if you give it a try! :-)

Displaying realtime memcached traffic on a backend

Sometimes I like to write down posts like this, to remind myself how to do something, sort of a mental note.
Suppose you have a few application servers that use 1+ memcached servers, and you want some way to display the outbound traffic, providing some insights on what are the most used keys, counters, etc…

Here's a quick way to do that, assuming you're using the memcached text protocol:

tcpflow -ce dst port 11211 
    | cut -b53- 
    | grep ^get 
    | pipestat --clear --runtime 60 --field 2 --time 1 --limit 40

What this does is:

  • Use tcpflow to capture all outbound traffic to destination port 11211, default memcached port.
  • Remove the first 53 bytes from each line, to filter out source and destination ip/ports
  • Only display get requests (alternatively, use set, incr, …)
  • Feed the resulting data to pipestat, a simple but great Perl tool that aggregates the data, displaying the most frequent ones. The specific options I used are good if you want to display quick statistics like other tools as top, mytop, or varnishstat.

It goes without saying that these tools are automatically installed on all servers that our Devops team here at Opera manages. I couldn't work without them :)

How to start up varnish with a custom cc_command on Debian

If you need to compile your varnish VCL file with custom options, maybe because of libraries like GeoIP, and you're running Debian, you can not use the init script that's shipped by default.

It will not work because of how shell expansion works in the start-stop-daemon command contained in the init script. I wrote my explanation and a proposed fix in much more detail in this stack overflow question:

http://stackoverflow.com/questions/5906603/varnish-daemon-opts-options-errors/8333333#8333333

TL;DR: (+ quick & dirty fix) patch your init script like this:

 start_varnishd() {
     log_daemon_msg "Starting $DESC" "$NAME"
     output=$(/bin/tempfile -s.varnish)
-    if start-stop-daemon 
-       --start --quiet --pidfile ${PIDFILE} --exec ${DAEMON} -- 
-       -P ${PIDFILE} ${DAEMON_OPTS} > ${output} 2>&1; then
+    if bash -c "start-stop-daemon 
+        --start --quiet --pidfile ${PIDFILE} --exec ${DAEMON} -- 
+        -P ${PIDFILE} ${DAEMON_OPTS} > ${output} 2>&1"; then
         log_end_msg 0
     else
         log_end_msg 1
         cat $output
         exit 1
     fi
     rm $output
 }

Let me know if it works for you!

EDIT (7/Mar/2012): bug was filed in Debian as #659005. Nothing happened so far. We'll see.

How to detect the Debian version of a server without logging in

As Ops team, we're slowly taking over operations for several other teams here at Opera. One of our first tasks is to:

First idea to check whether a server is Debian Lenny or Squeeze was to login and cat /etc/debian_version. However, if you haven't accessed that machine before, and your ssh keys are not there, you can't do that. In our case, we have to file a request for it, and it can take time. Wondering if there was a quicker way, I came up with this trick:

#!/bin/sh
#
# Tells the Debian version reading the OpenSSH banner
# Requires OpenSSH to be running and ssh port to be open.
#
# Usage: $0 <hostname>
#
# Cosimo, 23/11/2011

HOST=$1

if [ "x$HOST" = "x" ]; then
    echo "Usage: $0 <hostname>"
fi

OPENSSH_BANNER=$(echo "n" | nc ${HOST} 22 | head -1)

#echo "OPENSSH_BANNER=$OPENSSH_BANNER"

IS_SQUEEZE=$(echo $OPENSSH_BANNER | egrep '^SSH-.*OpenSSH_5.*Debian-6')
IS_LENNY=$(echo $OPENSSH_BANNER   | egrep '^SSH-.*OpenSSH_5.*Debian-5')
IS_ETCH=$(echo $OPENSSH_BANNER    | egrep '^SSH-.*OpenSSH_4.*Debian-9')

# SSH-2.0-OpenSSH_5.1p1 Debian-5
# SSH-2.0-OpenSSH_4.3p2 Debian-9etch3
# SSH-2.0-OpenSSH_5.5p1 Debian-6+squeeze1

#echo "Squeeze: $IS_SQUEEZE"
#echo "Lenny: $IS_LENNY"
#echo "Etch: $IS_ETCH"

if [ "x$IS_SQUEEZE" != "x" ]; then
    echo "$HOST is Debian 6.x (squeeze)"
    exit 0
fi

if [ "x$IS_LENNY" != "x" ]; then
    echo "$HOST is Debian 5.x (lenny)"
    exit 0
fi

if [ "x$IS_ETCH" != "x" ]; then
    echo "$HOST is Debian 4.x (etch)"
    exit 0
fi

echo "I don't know what $HOST is."
echo "Here's the openssh banner: '$OPENSSH_BANNER'"

exit 1

It reads the OpenSSH server banner to determine the major Debian version (Etch, Lenny, Squeeze). It's really fast, it's very simple and hopefully reliable too. Enjoy. Download from https://gist.github.com/1389206/.

Surge 2010 scalability conference in Baltimore, USA – DAY 2

This is a summary of day 2 of the Surge conference that took place in Baltimore, USA, 30th of September and 1st of October 2010. For a quite comprehensive blog post about day 1, you can read my previous post.

Here comes the list of talks I attended during Day 2.

Brian Cantryll – failures in commodity hardware

What happens when commodity hardware is used in an "enterprise" hardware project? Brian guided the audience through this industrial hw project. There was no recorded video of this talk, due to the content being potentially "sensitive". Very interesting talk, and Brian is IMO a very good speaker.

Benjamin Black – FastIP

Benjamin presented a – for me – new way to analyze metrics of a network, named "Flow". The flow-based network metrics can represent a network activity in a way that is completely different and much more accurate than what's usually done by operations and sysadmin departments. The downside is that is generates a lot of data. The advantage is that you can analyze and even replay? any traffic that took place between any two nodes of the network. I'm sure I didn't understand correctly because this would be amazing.

There's products out there that offer flow-based network analysis: Cisco Netflow, Ntop NProbe, etc… There's also a IETF working group about flow. We couldn't see any example/demo because there was a problem with the slides, IIRC.

FastIP also offers a related service. I contacted Benjamin about this after his talk. Maybe we'll be able to try something out or at least have a demonstration.

My TODO list:

Gavin Roy – Scaling MyYearBook.com

One of the most interesting talks in this conference IMO. MyYearbook is a Postgres shop, among the top 25 trafficked sites in the USA.

Gavin talked about many things they did to scale their site as the traffic was growing. Here's some of the things I remember:

  • DB connection pooling very important for them. Made a world of difference. They use PgBouncer and pgPool2
  • DB Horizontal scaling with pIProxy. TODO: look it up
  • DB Replication w/ Londiste, Slony, Bucardo
  • Postgresql 9.0 based standby to increase read-only capacity, and for hot-standby.
  • Partitioned the database by table, feature available since Pg 8.1

They have a primary-to-secondary master failover procedure. They looked into automating it, but a tech judgement is really necessary in case something goes wrong, so they will keep it manual. This was a question I asked to Gavin, since we've thought about automating our failover procedure for MySQL, but it's not so easy to just decide when to trigger the failover…

For user storage, they use Isilon IQ Series, apparently a FreeBSD appliance with on-board NFS. For DB servers, they looked at different solutions, but they keep coming back to direct attached storage. Their man db server, they have a massively powerful machine, IIRC, 512Gb of RAM and 128 cores machine. I have to double check this because it seems really impressive.

John Allspaw – Go or No Go

Another great talk by John, well presented and with great content. Not easy to summarize. The main topic was the "Go or no-go meeting", a 10 minutes get together of all involved parties before releasing changes or launching any new feature live.

This meeting basically consists of Yes/No questions:

  • Have you tested enough to deploy? QA still needed?
  • Has the feature being communicated (blog/forum/…)?
  • Does everyone know: when it will go live? who will push the feature?
  • Has the feature been in production for staff (or beta users)? That can be tricky to implement if the new feature implies social interactions (beta user tagging non-beta user)
  • Is it possible to dark launch this feature? Will we?
  • Is it possible to turn on this feature on a % of users? Will we?
  • Does it involve new infrastructure? If so: is there monitoring in place? (BLOCKER)
  • On/Off switch in the code/config is in place? Is it documented?
  • Are all the relevant people available for communication and launch?
  • Is there a place for users to provide feedback about the feature?
  • Post-launch "it's all done" time agreed?
  • Contingency checklist done and everytime reviewed it? (BLOCKER)

The "Contingency list" should answer the question: "What could possibly go wrong? What will we do about it?", with a list of potential issues and how to solve them in case shit hits the fan.

Apart from the Go/No-go meeting, which would be, also according to my past experience, a great way to avoid problems, there's at least a couple more really nice things to keep in mind when developing or launching a new feature:

  • "Dark launches": a dark launch is essentially a full launch of the new feature, but in such a way that is invisible to users. So if you're making db queries and processing stuff, you keep doing all that, you just throw the data away. You will be able to realize the (almost) full impact of the new feature on your application and compensate accordingly.
  • Feature "sampling" (% of users): you just enable the full feature for a small, and then growing, percentage of your user base. You can gradually grow to 100% and test the effect of the changes.

Great stuff.

Neil Gunther – Quantifying scalability

Here I was a bit too excited, due to my talk coming next, so unfortunately I didn't pay too much attention. It's a full analysis of scalability seen as a mathematical function, as capacity of your system as the load increases.

Cosimo Streppone – Scaling challenges of my.opera.com

I think

I used 5 minutes to show a live demo of the My Opera realtime monitor application that we built and afterwards I got very interesting questions, and also some nice twitter messages about it.

I also talked about how we've experimented in distributing requests across the different datacenters with our little geodns tool.

All in all, for me it was a fantastic experience. Practice will make me better, so I look forward to a next time :-)

Baron Schwartz – Scaling without sharding

Baron works for Percona. I had read some talks of his. I think he's a really good speaker. He explained in detail the scenarios that arise when dealing with database scaling, the typical characteristics of reads and writes, single server vs multiple servers deployments.

Basically what the talk tries to suggest is that very few situations require to shard your database. Single server setups can go very far, by optimizing the way the db works. Quote: "Sharding should be your last resort". Sharding should be enforced when write demand exceeds write capacity, so avoid sharding if you can, try to buffer/collate writes, defer update work, etc..

Closing day 2

Theo Schlossnagle closed the conference with a plenary keynote about a semi-serious "brief history of computing". Much fun, and a goodbye to next year's Surge.

For a glimpse of what happened live at the conference, you can also check out the Twitter stream for #surgecon.

Definitely a great conference. Stay tuned for videos and slides on the official site, http://omniti.com/surge/2010.

Surge 2010 scalability conference in Baltimore, USA – DAY 1

This was the first year the Surge conference took place, in Baltimore, USA. OmniTI is the company that organized it.

30" summary (TL;DR)

The conference was amazing. Main topic was scalability. Met a lot of people. 2 days, 2 tracks and 20+ speakers. Several interesting new products and technologies to evaluate.

The long story

The conference topics were scalability, databases and web operations. It took place over two days filled with high-level talks about experiences, failures, and advice on scaling web sites.

The only downside is that I had to miss half of the talks, being alone :). The good thing is that all videos and slides will be up on the conference website Soon™

Lots of things to be mentioned but I'll try to summarize what happened in Day 1.

John Allspaw – Web Engineering

First keynote session by John Allspaw, former Flickr dev, now Etsy.com.

Summary: Web engineering (aka Web Operations) is still a young field. We must set out to achieve much higher goals, be more scientific. We don't need to invent anything. We should be able to get inspiration and prior art from other fields like aerospace, civil engineering, etc…

He had lots of examples in his slides. I want to go through this talk again. Really inspiring.

Theo Schlossnagle – Scalable Design Patterns

Theo's message was clear. Tools can work no matter what technology. Bend technologies to your needs. You don't need the shiniest/awesomest/webscalest. Monitoring is key. Tie metrics to your business. Be relevant to your business people.

Ronald Bradford – Most common MySQL scalability mistakes

If you're starting with MySQL, or don't have too much experience, then you definitely want to listen to Ronald's talk. Will save you a few years of frustration. :)

Companion website, monitoring-mysql.com.

Ruslan Belkin – Scaling LinkedIn

Ruslan is very prepared and technical, but maybe I expected a slightly different type of content. I must read again the slides when they're up. LinkedIn is a mostly ("99%") Java, uses Lucene as main search tier. Very interesting: they mentioned that since 2005-2006, they have been using several specific services (friends, groups, profiles, etc…) instead of one big database. This allows them to scale better and more predictably.

They also seem to use a really vast array of different technologies, like Voldemort, and many others I don't remember the names right now.

Robert Treat – Database scalability patterns

Robert is a very experienced DBA with no doubt. He talked about all different types of MySQL configurations available to developers in need of scaling their apps, explaining them and providing examples: horizontal/vertical partitioning, h/v scaling, etc…

I was late for this talk so I only got the final part.

Tom Cook – A day in the life of Facebook operations

I listened to the first 10-15 minutes of this talk, and I had the impression that this was probably the 3rd time I listen to the same talk, that tells us how big Facebook is, upload numbers, status updates, etc… without going into specific details. This of course is very impressive, but it's the low-level stuff that's more interesting, at least for me.

Last time I had attended this talk was in Brussels for Fosdem. I was a bit disappointed so I left early. According to some later tweets, the last part was the most interesting. Have to go back on this one, and watch the video. Well… at least I got to listen to the last part of…

Arthur Bergman – Scaling Wikia

Lots of Varnish knowledge (and more) in this talk!

I had read some earlier talks by Artur, always about Varnish, and I have learnt a lot from him.
I strongly suggest to go through his talks if you're interested in Varnish.

They "abused" Urchin tracker (Google Analytics) javascript code to measure their own statistics about server errors and client-side page loading times. Another cool trick is the use of a custom made-up X-Vary-URL HTTP header to keep all linked URLs (view/edit/etc.. regarding a single wiki page) in one varnish hash slot. In this case, with a single purge command you can get rid of all relevant pages linked to the same content.

They use SSDs extensively. A typical Wikia server (Varnish and/or DB) has got:

  • 2 x 6 cores westmere processor
  • 6 x Intel X25 SSD (~ $2000)
  • 2 x spinning drives for transaction logs (db)

"SSD allows you JOINs with no performance degradation."

Peak speeds reached (this is random not sequential: amazing!):

  • 500 Mbyte/s random read with avg latency of 0.2 ms
  • 220 Mbyte/s random writes

They use their own CDN based on Dynect (I think a Dyn Inc. service, see below).
Still using Akamai for a minor part of their static content.

Wikia is looking into using Riak, and a Riak-based filesystem to hook up directly to Varnish for really fast file serving.

Mike Malone – SimpleGeo

SimpleGeo implemented a geographic database over apache cassandra, able to answer spatial queries. They researched into using PostGIS (postgres-based GIS DB, very common product), but wasn't as flexible as they needed (don't remember exactly why).

TODO: look into "Distributed indexes over-DHT". He indicated it as prior art for their system.
This talk was a bit complicated for me to follow, so I'll have to watch it again.

Closing day 1

At the end of the day, there was a SQL vs NoSQL panel, which I skipped entirely. Maybe it was interesting :) The after-hours event that closed day 1 was organized by Dyn Inc. It was fantastic. Lots of good beer, martinis, and good food. I went to bed early, since I was still jetlagged. Day 2 started at 9 AM.

Time for a break :)

And then on to Day 2:

http://my.opera.com/cstrep/blog/2010/10/07/surge-2010-scalability-conference-in-baltimore-usa-day-2